Australian Weather News


AWN Home Page
Full news index

Wednesday, 23 OCT 2002

About Australian Weather News

Worst dust storm in decades sweeps across four states
Other notes on significant weather for today not yet written
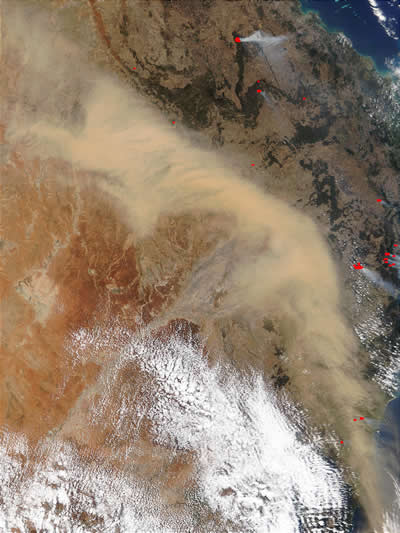
This satellite image above, from NASA's Land Rapid Response System, shows the enormous spread of today's dust storm. The image was taken about 11am EST as the dust storm arrived in Sydney, and has been corrected to show true colour. The dust extends 1,500km from east of the southeastern corner of Australia at the bottom right of the image to near Mt Isa in Queensland at the top left. The red dots mark active bushfires. The 10am EST weather map from the BoM below shows the location of the cold front and surface trough at about the same time.

A strong, gusty southwest wind change swept tens of millions of tonnes of dust across eastern states today, giving many areas one of their worst dust storms on record. Raised dust, which was widespread in South Australia yesterday, spread across northern Victoria and NSW overnight, arriving in SW Queensland and eastern NSW after dawn this morning. The dust storm was at its worst in western NSW and Queensland, with visibility reduced to 50m in places as fresh dust was whipped up from bone dry soil with reduced vegetation cover and mixed through the lower atmosphere by strong, gusty winds.

Professor Grant McTainsh, a wind erosion specialist at Griffith University Queensland, said "This is one of the biggest dust storms in the last 20 years, it's enormous. It could easily have tens of millions of tonnes of dust. It was 6km high at Charleville, southern Queensland. That's incredible. Usually, storms stop picking up dust as they move east. But this picked up dust all the way to the coast." Professor McTainsh said a million tonnes of dust was equivalent to 200,000 semi-trailer loads. "That's two million trailer loads of dust blown away. Most of it ended in the ocean."

The dust storm covered over 450,000 square kilometres of NSW and Queensland, obliterating the sky with an orange/red veil and turning the sun into a dull silvery yellow disc. Visibility at Lightning Ridge in NW NSW during the morning was unofficially reported as low as 50m, and was officially measured at 100m at Roma, Qld, during the afternoon. Visibilities of between 300 and 500m were common across inland NSW and Queensland during the height of the storm. The mayor of Murweh Shire, which includes Charleville Qld, said it was the worst dust storm in the area since 1965.

In Sydney, Julie Evans from the Sydney Bureau of Meteorology said the dust storm arrived around 11am, reducing visibility to a few kilometres and extending 2.5km up into the atmosphere. Previous dust storms in Sydney occurred in April 1994, September 1968, December 1957, and January 1942, when the most severe dust storm to hit the city reduced visibility at Sydney airport to 500 metres.


National weather extremes for today
Data provided by the Bureau of Meteorology
Last updated at 18:42 EST on 26/10/02

Quality control note: Data is complete, and has been visually checked by AWN for gross errors. Less obvious errors may remain. See Explanation of Extremes Pages for more information

Records set this day (previous record and years of computerised record shown in brackets):
Highest daily maximum temperature for any month:
Doongan WA: 44.0 (41.5, 14)

Highest daily maximum temperature for October:
Western Australia
Kimberley Res Stn: 44.7 (44.2, 46)
Warmun: 44.9 (44.8, 40)
Kununurra Aero: 44.0 (43.5, 16)
Meekatharra AP: 40.4 (40.2, 52)
Northern Territory
Larrimah: 43.0 (42.9, 37)
Daly Waters AWS: 43.0 (43.0, 33) equalling record set yesterday
Wave Hill: 45.0 (43.5, 28)
Katherine Aviation Museum: 41.6 (40.9, 17) breaking record set 3 days ago
Queensland
Kairi Res Stn: 37.2 (34.6, 35)
Walkamin DPI: 37.5 (36.6, 34)

Todays highest rainfall totals for the 24 hours to 9am. It includes the top 5 totals received, and/or all reported falls of 50mm or more.

42.4 ZEEHAN MEMORIAL MUSEUM W Coast TAS
42.0 QUAMBY BLUFF(WILDLIFE NURSERY) N Coast TAS
41.6 MOLE CREEK N Coast TAS
38.2 RAILTON (GOLIATH CEMENT WORKS) N Coast TAS
36.2 LAKE MARGARET POWER STATION W Coast TAS

TASMANIA
    N Coast
42.0 QUAMBY BLUFF(WILDLIFE NURSERY)
41.6 MOLE CREEK
38.2 RAILTON (GOLIATH CEMENT WORKS)
    W Coast
42.4 ZEEHAN MEMORIAL MUSEUM
36.2 LAKE MARGARET POWER STATION

High rainfall for periods of 6 hours or less.


VICTORIA
    E Central
DUNNS HILL
15.0mm in 3 hr to 03:00 5.0mm/h

TASMANIA
    W Coast
MOUNT READ
15.0mm in 3 hr to 03:00 5.0mm/h

ISLANDS
    Islands
NORFOLK ISLAND AERO
11.6mm in 1 hr to 05:00 11.6mm/h

Todays highest & lowest temperatures

Maximum Minimum
45.1 PANNAWONICA W Pilbara WA
45.0 WYNDHAM AERO N Kimberley WA
45.0 CADJEBUT W Kimberley WA
45.0 FITZROY CROSSING AERO W Kimberley WA
45.0 MARBLE BAR E Pilbara WA
45.0 WAVE HILL Victoria NT
28.0 DUM IN MIRRIE Darwin-Daly NT
28.0 NORTHERN ENDEAVOUR Islands
27.4 CHANNEL POINT Darwin-Daly NT
27.2 DARWIN AIRPORT Darwin-Daly NT
27.1 DARWIN AIRPORT COMPARISON N Rivers NT
2.0 THREDBO (CRACKENBACK STATION) AWS Snowy Mtns NSW
2.0 CHARLOTTE PASS (KOSCIUSKO CHALET) Snowy Mtns NSW
3.8 MOUNT WELLINGTON Southeast TAS
5.1 PERISHER VALLEY SKI CENTRE Snowy Mtns NSW
5.2 CRADLE MOUNTAIN AIRSTRIP Central Plateau TAS
-1.1 MOUNT WELLINGTON Southeast TAS
-1.0 MOUNT BULLER Upper NE VIC
-1.0 MOUNT READ W Coast TAS
-0.8 MT HOTHAM Upper NE VIC

Todays greatest temperature variations from normal

Maximum Minimum
+13.6   36.9 YAMBA PILOT STATION North Coast NSW
+12.4   44.0 ONSLOW W Pilbara WA
+11.5   44.0 ONSLOW AIRPORT W Pilbara WA
+11.1   40.4 MEEKATHARRA AIRPORT Murchison WA
+11.0   41.0 WILUNA Interior WA
+11.0   38.5 AMBERLEY AMO Brisbane/SE Coast QLD
+11.0   37.5 GRAFTON OLYMPIC POOL North Coast NSW
+10.2   19.8 BENCUBBIN Cent Wheatbelt WA
+9.2   18.6 MERREDIN Cent Wheatbelt WA
+8.4   17.2 KELLERBERRIN Cent Wheatbelt WA
+8.2   23.1 MEEKATHARRA AIRPORT Murchison WA
+8.2   14.1 LITHGOW (BIRDWOOD ST) C Tablelands S NSW
-7.7   14.0 YONGALA Upper North SA
-7.5   16.2 KIMBA W Agricultural SA
-6.8   2.0 CHARLOTTE PASS (KOSCIUSKO CHALET) Snowy Mtns NSW
-6.6   11.2 NOOJEE (SLIVAR) W Gippsland VIC
-6.5   17.9 BALRANALD RSL Southwest Plains NSW
-6.2   4.0 EYRE Eucla WA
-5.4   16.0 DALY WATERS AWS Roper-McArthur NT
-5.3   14.5 GEORGETOWN POST OFFICE Upper Carpentaria QLD
-4.6   17.0 WAVE HILL Victoria NT

Highest wind gusts above 89km/h or mean wind above 62km/h (gale force). Wind direction and mean windspeed shown in brackets.

NEPTUNE ISLAND W Agricultural SA : 76 (230/ 63 ) at 07:30
BIRDSVILLE AIRPORT Channel Country QLD: 72 (210/ 63 ) at 00:11
RUNDLE ISLAND Wide Bay/Burnett QLD: 76 (360/ 63 ) at 15:00
CAPE MORETON LIGHTHOUSE Brisbane/SE Coast QLD: 80 (350/ 63 ) at 14:00
ARMIDALE AIRPORT AWS N Tablelands W NSW: 80 (310/ 65 ) at 10:23
GLEN INNES AIRPORT AWS N Tablelands W NSW: 80 (320/ 67 ) at 11:07
MOUNT BOYCE AWS C Tablelands S NSW: 93 (250/ 63 ) at 13:31
MONTAGUE ISLAND LIGHTHOUSE South Coast NSW: 93 (220/ 72 ) at 17:23
GREEN CAPE AWS South Coast NSW: 83 (240/ 70 ) at 09:00
THREDBO (CRACKENBACK STATION) AWS Snowy Mtns NSW: 83 (320/ 63 ) at 06:00
WALPEUP RESEARCH Mallee N VIC: 78 (240/ 63 ) at 12:21
HORSHAM AERODROME Wimmera S VIC: 74 (230/ 63 ) at 12:13
MOUNT BULLER Upper NE VIC: 91 (350/ 58 ) at 00:30
MT HOTHAM Upper NE VIC: 108 (350/ 70 ) at 00:00
WILSONS PROMONTORY LIGHTHOUSE W Gippsland VIC: 109 (240/ 96 ) at 05:55
KINGFISH A SHIP LOG 206 W Gippsland VIC: 85 (252/ 65 ) at 10:00
AVALON AIRPORT W Central VIC: 76 (240/ 65 ) at 13:48
COLAC (MT GELLIBRAND) W Coast VIC: 72 (250/ 63 ) at 07:57
CAPE GRIM B.A.P.S. N Coast TAS: 89 (240/ 67 ) at 05:00
MOUNT WELLINGTON Southeast TAS: 91 (340/ 72 ) at 00:27
TASMAN ISLAND Southeast TAS: 74 ( 10/ 63 ) at 04:00
CAPE BRUNY (CAPE BRUNY) Southeast TAS: 82 (240/ 63 ) at 21:28
FLINDERS ISLAND AIRPORT Flinders Is/Bass St TAS: 74 (260/ 63 ) at 09:00

Other extremes

..