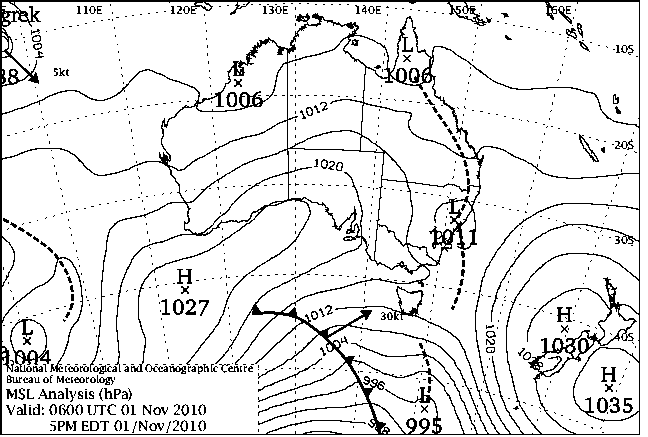
|
For notes on how to interpret
the data and quality control issues, see Daily Weather Summary Help.
**S** and **W** precede data flagged by the Bureau as suspicious or wrong
Data is as received at 06:01EST, 24/05/2012.
|
|
| |
Max
°
C |
+/- norm
°
C |
Min
°
C |
+/- norm
°
C |
Grass Min
°
C |
Rain to 9am mm |
Evaporation to 9am mm |
Sunshine hours |
Wind Run to 9am km (24-hour average km/h) |
Maximum Gust km/h / hour of occurrence |
| GERALDTON AIRPORT |
33.1 |
+6.0 |
14.3 |
+0.5 |
7.9 |
0.0 |
13.0 |
-- |
496 (20.7) |
44/07 |
| PERTH AIRPORT |
31.1 |
+5.3 |
11.7 |
-0.9 |
8.7 |
0.0 |
9.2 |
12.7 |
473 (19.7) |
50/14 |
| ALBANY AIRPORT |
22.9 |
+2.1 |
10.0 |
-0.8 |
3.1 |
0.0 |
6.4 |
11.6 |
446 (18.6) |
43/15 |
| BUNBURY |
27.5 |
+3.3 |
12.4 |
+0.4 |
-- |
0.0 |
-- |
-- |
296 (12.3) |
30/12 |
| MANDURAH |
27.4 |
-- |
15.6 |
-- |
-- |
0.0 |
-- |
-- |
326 (13.6) |
35/15 |
| DARWIN AIRPORT |
32.8 |
-0.5 |
23.2 |
-2.1 |
23.5 |
0.2 |
4.6 |
9.0 |
375 (15.6) |
48/13 |
| ALICE SPRINGS AIRPORT |
21.5 |
-12.1 |
4.7 |
-13.2 |
3.7 |
0.0 |
6.4 |
12.2 |
337 (14.0) |
43/09 |
| WHYALLA AERO |
17.3 |
-9.2 |
5.3 |
-8.6 |
-- |
0.8 |
8.8 |
-- |
412 (17.2) |
50/19 |
| ADELAIDE (KENT TOWN) |
18.0 |
-7.1 |
5.3 |
-8.7 |
3.5 |
2.4 |
4.2 |
10.1 |
288 (12.0) |
28/12 |
| MOUNT GAMBIER AERO |
15.9 |
-4.5 |
4.1 |
-4.3 |
2.0 |
0.2 |
3.6 |
2.9 |
410 (17.1) |
41/15 |
| MOUNT ISA AERO |
26.1 |
-10.3 |
13.2 |
-8.2 |
12.7 |
17.2 |
5.0 |
6.1 |
472 (19.7) |
44/06 |
| CAIRNS AERO |
31.3 |
+0.7 |
21.3 |
-1.0 |
19.4 |
0.0 |
6.2 |
11.8 |
411 (17.1) |
31/14 |
| TOWNSVILLE AERO |
31.1 |
+0.3 |
21.5 |
-1.4 |
19.5 |
0.0 |
8.6 |
10.2 |
354 (14.8) |
34/12 |
| MACKAY M.O |
27.8 |
-1.4 |
21.8 |
+0.1 |
-- |
1.0 |
-- |
6.9 |
342 (14.3) |
35/23 |
| ROCKHAMPTON AERO |
28.7 |
-2.5 |
19.3 |
-0.2 |
18.3 |
0.0 |
5.0 |
-- |
271 (11.3) |
30/15 |
| BUNDABERG AERO |
27.1 |
-1.2 |
16.0 |
-2.9 |
-- |
0.0 |
-- |
-- |
294 (12.3) |
26/16 |
| NAMBOUR DPI |
24.0 |
-4.0 |
14.0 |
-2.3 |
-- |
0.0 |
-- |
-- |
-- |
-- |
| COOLANGATTA |
24.2 |
-1.6 |
15.1 |
-3.1 |
-- |
0.0 |
-- |
-- |
179 ( 7.5) |
30/16 |
| BRISBANE AERO |
22.5 |
-4.3 |
16.2 |
-1.8 |
12.8 |
0.0 |
4.2 |
0.3 |
206 ( 8.6) |
34/20 |
| TOOWOOMBA AIRPORT |
20.8 |
-4.9 |
14.4 |
-0.1 |
-- |
0.0 |
-- |
-- |
397 (16.5) |
34/01 |
| GUNNEDAH RESOURCE CENTRE |
21.5 |
-6.8 |
15.7 |
+0.7 |
13.2 |
0.2 |
4.6 |
-- |
211 ( 8.8) |
-- |
| COFFS HARBOUR MO |
22.2 |
-2.7 |
18.9 |
+2.8 |
16.5 |
0.0 |
5.6 |
0.3 |
563 (23.5) |
41/13 |
| PORT MACQUARIE AIRPORT AWS |
25.0 |
+0.1 |
18.0 |
+3.0 |
-- |
0.0 |
-- |
-- |
-- |
-- |
| WILLIAMTOWN RAAF |
21.8 |
-3.6 |
18.8 |
+4.5 |
18.4 |
12.6 |
5.2 |
0.1 |
284 (11.8) |
48/11 |
| GOSFORD (NARARA RESEARCH STATION) AWS |
19.7 |
-5.4 |
16.0 |
+2.9 |
-- |
0.6 |
-- |
-- |
61 ( 2.5) |
30/12 |
| ORANGE AGRICULTURAL INSTITUTE |
16.1 |
-5.0 |
7.1 |
-2.0 |
3.1 |
0.1 |
5.4 |
11.5 |
-- |
-- |
| DUBBO AIRPORT AWS |
21.9 |
-6.5 |
8.4 |
-5.2 |
-- |
0.6 |
-- |
-- |
273 (11.4) |
54/16 |
| SYDNEY AIRPORT AMO |
18.5 |
-5.5 |
17.6 |
+2.3 |
14.9 |
0.0 |
6.6 |
0.1 |
655 (27.3) |
52/07 |
| RICHMOND RAAF |
20.7 |
-5.9 |
14.7 |
+0.8 |
-- |
0.2 |
-- |
-- |
184 ( 7.7) |
28/13 |
| BELLAMBI AWS |
17.2 |
-4.9 |
16.0 |
+0.4 |
-- |
0.0 |
-- |
-- |
558 (23.3) |
54/20 |
| CANBERRA AIRPORT COMPARISON |
19.0 |
-3.7 |
7.7 |
-1.1 |
6.0 |
0.0 |
-- |
-- |
-- |
-- |
| WAGGA WAGGA AMO |
18.1 |
-7.6 |
11.5 |
+0.8 |
10.4 |
0.0 |
4.6 |
4.7 |
314 (13.1) |
39/16 |
| ALBURY AIRPORT AWS |
18.9 |
-7.1 |
10.2 |
-1.4 |
-- |
1.2 |
-- |
-- |
260 (10.8) |
35/15 |
| MILDURA AIRPORT |
18.9 |
-8.5 |
5.8 |
-6.7 |
3.7 |
0.2 |
4.2 |
12.7 |
366 (15.3) |
37/10 |
| TATURA INST SUSTAINABLE AG |
18.0 |
-6.6 |
6.6 |
-3.5 |
-- |
1.0 |
14.8 |
-- |
395 (16.5) |
35/10 |
| BENDIGO AIRPORT |
16.1 |
-8.1 |
3.4 |
-6.1 |
-- |
1.2 |
-- |
-- |
309 (12.9) |
�
37/08 |
| MELBOURNE REGIONAL OFFICE |
16.7 |
-5.2 |
9.2 |
-2.0 |
-- |
3.8 |
-- |
-- |
-- |
-- |
| GROVEDALE (GEELONG AIRPORT) |
16.3 |
-4.7 |
4.5 |
-5.1 |
-- |
0.2 |
-- |
-- |
471 (19.6) |
41/13 |
| BALLARAT AERODROME |
11.8 |
-7.8 |
2.2 |
-5.6 |
-- |
1.2 |
-- |
-- |
371 (15.5) |
35/13 |
| LAUNCESTON (TI TREE BEND) |
16.2 |
-4.2 |
6.2 |
-2.7 |
-- |
3.0 |
-- |
-- |
456 (19.0) |
35/14 |
| HOBART AIRPORT |
17.5 |
-1.5 |
9.9 |
+0.7 |
7.0 |
1.6 |
4.4 |
6.3 |
648 (27.0) |
61/01 |
| |
Max
°
C |
+/- norm
°
C |
Min
°
C |
+/- norm
°
C |
Grass Min
°
C |
Rain to 9am mm |
Evaporation to 9am mm |
Sunshine hours |
Wind Run to 9am km |
Maximum Gust km/h / hour of occurrence |
|
| Hottest |
| Highest maximum temperature> | Greatest variation above normal maximum |
Highest minimum temperature | Greatest variation above normal minimum |
37.8 CURTIN AERO W Kimberley WA
37.8 MARDIE W Pilbara WA
37.7 WEST ROEBUCK W Kimberley WA
37.1 BROOME AIRPORT W Kimberley WA
37.0 MANDORA E Pilbara WA
37.0 ROEBOURNE E Pilbara WA
|
+8.1 : 35.6 CARNARVON AIRPORT W Gascoyne WA
+7.4 : 27.5 CAPE LEEUWIN Lower West WA
+7.3 : 32.0 LANCELIN Lower West WA
+7.1 : 28.9 MANJIMUP Lower West WA
+7.0 : 35.0 KALBARRI Central West WA
|
29.0 NORTHERN ENDEAVOUR Islands ISL
26.4 COCONUT ISLAND N Peninsula QLD
26.2 HORN ISLAND N Peninsula QLD
26.0 BIDYADANGA W Kimberley WA
26.0 TROUGHTON ISLAND N Kimberley WA
26.0 BEDOUT ISLAND E Pilbara WA
26.0 CAPE DON N Rivers NT
|
+5.1 : 19.9 KALBARRI Central West WA
+4.5 : 18.8 WILLIAMTOWN RAAF Hunter Valley NSW
+4.5 : 18.6 MAITLAND VISITORS CENTRE Hunter Valley NSW
+4.4 : 18.2 YARRAS (MOUNT SEAVIEW) MidNorth Coast S NSW
+4.3 : 18.0 CESSNOCK (NULKABA) Hunter Valley NSW
|
| Coldest |
| Lowest maximum temperature | Greatest variation below normal maximum |
Lowest minimum temperature | Greatest variation below normal minimum |
2.2 MT BAW BAW W Gippsland VIC
4.1 MT HOTHAM Upper NE VIC
4.4 MOUNT BULLER Upper NE VIC
4.8 MOUNT READ W Coast TAS
5.8 FALLS CREEK Upper NE VIC
|
-14.3 : 17.7 SURAT Maranoa QLD
-13.7 : 18.2 MITCHELL POST OFFICE Maranoa QLD
-13.7 : 17.9 ROMA AIRPORT Maranoa QLD
-13.5 : 20.1 ARLTUNGA N Plateau NT
-13.5 : 18.0 INJUNE POST OFFICE Maranoa QLD
|
-1.4 MOUNT BAW BAW W Gippsland VIC
-1.2 YONGALA Upper North SA
-1.0 GRAMPIANS (MOUNT WILLIAM) Wimmera S VIC
-0.4 MOUNT WELLINGTON Southeast TAS
-0.4 MOUNT READ W Coast TAS
|
-13.2 : 4.7 ALICE SPRINGS AIRPORT N Plateau NT
-13.0 : 5.4 KULGERA N Plateau NT
-13.0 : 8.4 BIRDSVILLE AIRPORT Channel Country QLD
-12.0 : 0.0 EYRE Eucla WA
-11.9 : 6.6 ARLTUNGA N Plateau NT
-11.9 : 7.1 JERVOIS N Plateau NT
|
|
Sunniest &
dullest |
Windiest |
Highest gusts |
Todays highest rainfall totals for the 24 hours to 9am. It
includes the top 5 totals nationally followed by all reported falls of 50mm or more. |
Highest
and lowest recordings of hours of sunshine for the 24 hours to midnight. |
Highest wind
run totals in kilometres for the 24 hours to 9am (average speed in brackets).
All reported runs >
=25km/h are shown. |
Highest wind
gusts in km/h for the 24 hours to midnight followed by the hour in which it occurred.
All stations with gusts >
89km/h are shown. |
89.4 NORTH EAST ISLAND Islands ISL
66.6 UPPER WATERHOUSE RIVER N Rivers NT
64.8 WARRUMBUNGLE (CHEDDINGTON) CW Plains N NSW
63.8 GIBB RIVER E Kimberley WA
57.0 SIDDINS CREEK E Kimberley WA
WESTERN AUSTRALIA
E Kimberley
63.8 GIBB RIVER
57.0 SIDDINS CREEK
NORTHERN TERRITORY
N Rivers
66.6 UPPER WATERHOUSE RIVER
NEW SOUTH WALES
CW Plains N
64.8 WARRUMBUNGLE (CHEDDINGTON)
Illawarra
55.0 KIAMA BOWLING CLUB
Riverina E
55.6 HENTY POST OFFICE
ISLANDS
Islands
89.4 NORTH EAST ISLAND
55.2 COCOS ISLAND AIRPORT
|
12.7 PERTH AIRPORT Lower West WA
12.7 MILDURA AIRPORT Mallee N VIC
12.6 GILES METEOROLOGICAL OFFICE Interior WA
12.5 WOOMERA AERODROME NW Pastoral SA
12.2 ALICE SPRINGS AIRPORT N Plateau NT
.....
0.3 BRISBANE AERO Brisbane/SE Coast QLD
0.3 COFFS HARBOUR MO MidNorth Coast N NSW
0.1 WILLIAMTOWN RAAF Hunter Valley NSW
0.1 SYDNEY AIRPORT AMO Sydney--east NSW
0.0 SCONE SCS Hunter Valley NSW
|
1212 (50.5) MOUNT WELLINGTON Southeast TAS
1167 (48.6) HOGAN ISLAND Islands ISL
1099 (45.8) CAPE GRIM BAPS N Coast TAS
1052 (43.8) LOW HEAD N Coast TAS
959 (40.0) FLINDERS ISLAND AIRPORT Flinders Is/Bass St TAS
919 (38.3) SWAN ISLAND E Coast TAS
912 (38.0) TASMAN ISLAND Southeast TAS
907 (37.8) GABO ISLAND LIGHTHOUSE E Gippsland VIC
877 (36.5) NORFOLK ISLAND AERO Islands ISL
871 (36.3) MONTAGUE ISLAND LIGHTHOUSE South Coast NSW
839 (35.0) MAATSUYKER ISLAND LIGHTHOUSE Southeast TAS
837 (34.9) MOUNT HOTHAM Upper NE VIC
826 (34.4) EDDYSTONE POINT E Coast TAS
806 (33.6) DEVONPORT AIRPORT N Coast TAS
781 (32.5) GREEN CAPE AWS South Coast NSW
775 (32.3) COCOS ISLAND AIRPORT Islands ISL
774 (32.3) KING ISLAND AIRPORT King Island TAS
770 (32.1) MOUNT READ W Coast TAS
767 (32.0) WILSONS PROMONTORY LIGHTHOUSE W Gippsland VIC
742 (30.9) TUNNACK FIRE STATION Southeast TAS
739 (30.8) CAPE OTWAY LIGHTHOUSE W Coast VIC
719 (30.0) CAPE LEEUWIN Lower West WA
708 (29.5) FALLS CREEK Upper NE VIC
678 (28.3) BURKETOWN AIRPORT Gulf Country QLD
676 (28.2) LIAWENEE Central Plateau TAS
655 (27.3) SYDNEY AIRPORT AMO Sydney--east NSW
648 (27.0) HOBART AIRPORT Southeast TAS
641 (26.7) HARTZ MOUNTAIN (KEOGHS PIMPLE) Southeast TAS
634 (26.4) SCOTTS PEAK DAM W Coast TAS
631 (26.3) NORMANTON AIRPORT Gulf Country QLD
626 (26.1) RUNDLE ISLAND Wide Bay/Burnett QLD
622 (25.9) VARANUS ISLAND Islands ISL
605 (25.2) COLAC (MOUNT GELLIBRAND) W Coast VIC
601 (25.0) TELFER AERO Interior WA
600 (25.0) CAPE FLATTERY N Coast--Barron QLD
600 (25.0) PORT FAIRY AWS W Coast VIC
|
89/02 MAATSUYKER ISLAND LIGHTHOUSE Southeast TAS
85/06 MOUNT WELLINGTON Southeast TAS
81/02 HARTZ MOUNTAIN (KEOGHS PIMPLE) Southeast TAS
72/02 TASMAN ISLAND Southeast TAS
72/01 SCOTTS PEAK DAM W Coast TAS
|
�