|
For notes on how to interpret
the data and quality control issues, see Daily Weather Summary Help.
**S** and **W** precede data flagged by the Bureau as suspicious or wrong
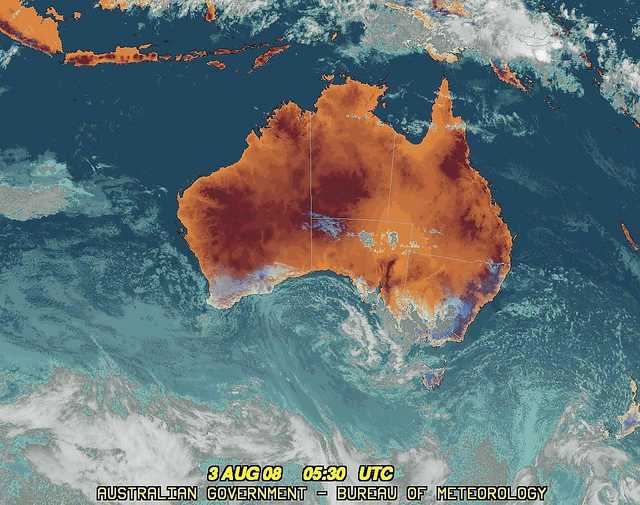
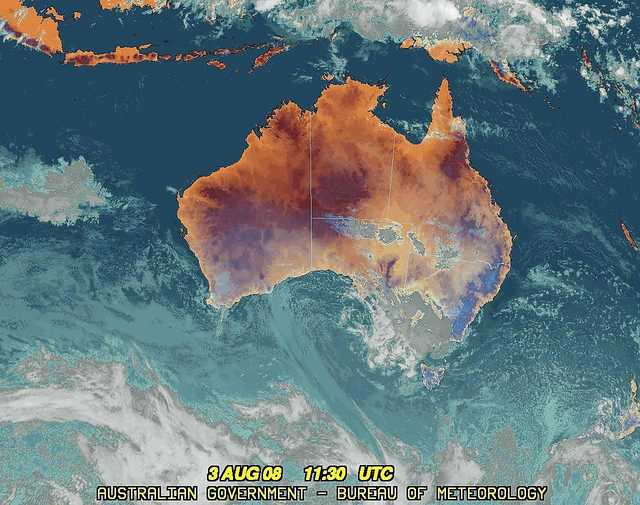
Data is as received at 02:53EST, 15/05/2012.
|
|
| |
Max
°
C |
+/- norm
°
C |
Min
°
C |
+/- norm
°
C |
Grass Min
°
C |
Rain to 9am mm |
Evaporation to 9am mm |
Sunshine hours |
Wind Run to 9am km (24-hour average km/h) |
Maximum Gust km/h / hour of occurrence |
| GERALDTON AIRPORT |
17.0 |
-3.0 |
8.4 |
-0.5 |
5.3 |
1.6 |
1.4 |
-- |
277 (11.5) |
35/15 |
| PERTH AIRPORT |
17.1 |
-1.3 |
3.7 |
-4.3 |
2.7 |
0.0 |
2.6 |
9.7 |
327 (13.6) |
34/11 |
| ALBANY AIRPORT |
14.6 |
-1.5 |
8.4 |
+0.9 |
6.5 |
5.4 |
2.8 |
5.3 |
463 (19.3) |
43/00 |
| BUNBURY |
15.8 |
-1.5 |
3.5 |
-4.1 |
-- |
0.0 |
-- |
-- |
185 ( 7.7) |
24/11 |
| MANDURAH |
16.6 |
-- |
9.1 |
-- |
-- |
1.0 |
-- |
-- |
273 (11.4) |
26/11 |
| DARWIN AIRPORT |
34.1 |
+2.8 |
18.8 |
-1.6 |
17.0 |
0.0 |
6.2 |
11.4 |
370 (15.4) |
54/12 |
| ALICE SPRINGS AIRPORT |
30.1 |
+7.5 |
10.3 |
+4.3 |
8.2 |
0.0 |
6.0 |
10.7 |
303 (12.6) |
31/13 |
| WHYALLA AERO |
21.7 |
+3.2 |
2.4 |
-3.5 |
-- |
0.0 |
5.2 |
-- |
241 (10.0) |
50/12 |
| ADELAIDE (KENT TOWN) |
18.1 |
+1.4 |
7.2 |
-1.0 |
-- |
1.0 |
-- |
5.6 |
209 ( 8.7) |
39/13 |
| MOUNT GAMBIER AERO |
14.0 |
-0.1 |
5.8 |
+0.3 |
4.2 |
0.6 |
1.4 |
3.7 |
347 (14.5) |
39/11 |
| MOUNT ISA AERO |
30.6 |
+3.3 |
6.8 |
-3.5 |
5.1 |
0.0 |
6.2 |
10.8 |
224 ( 9.3) |
30/14 |
| CAIRNS AERO |
27.1 |
+0.5 |
12.0 |
-5.4 |
7.1 |
0.0 |
5.2 |
10.3 |
147 ( 6.1) |
31/15 |
| TOWNSVILLE AERO |
24.8 |
-1.2 |
12.7 |
-2.0 |
11.5 |
0.0 |
4.8 |
10.5 |
140 ( 5.8) |
31/12 |
| MACKAY M.O |
20.4 |
-2.1 |
11.6 |
-2.4 |
-- |
0.0 |
-- |
10.9 |
311 (13.0) |
28/11 |
| ROCKHAMPTON AERO |
23.5 |
-1.3 |
5.8 |
-4.8 |
2.2 |
0.0 |
5.2 |
-- |
199 ( 8.3) |
15/12 |
| BUNDABERG AERO |
21.8 |
-1.5 |
5.9 |
-5.0 |
-- |
0.0 |
1.8 |
-- |
356 (14.8) |
28/08 |
| NAMBOUR DPI |
21.0 |
-1.5 |
6.0 |
-2.0 |
-- |
0.0 |
-- |
-- |
-- |
-- |
| COOLANGATTA |
20.5 |
-0.8 |
5.6 |
-4.8 |
-- |
0.0 |
-- |
-- |
183 ( 7.6) |
24/13 |
| BRISBANE AERO |
19.6 |
-2.2 |
5.8 |
-3.8 |
0.5 |
0.0 |
5.6 |
10.1 |
427 (17.8) |
30/00 |
| TOOWOOMBA AIRPORT |
17.8 |
-0.9 |
2.5 |
-5.0 |
-- |
0.0 |
-- |
-- |
530 (22.1) |
30/08 |
| GUNNEDAH RESOURCE CENTRE |
14.8 |
-3.1 |
1.2 |
-4.6 |
-3.7 |
0.0 |
1.6 |
-- |
117 ( 4.9) |
-- |
| COFFS HARBOUR MO |
17.0 |
-2.8 |
2.5 |
-5.7 |
-1.6 |
0.0 |
3.4 |
9.6 |
337 (14.0) |
26/00 |
| PORT MACQUARIE AIRPORT AWS |
18.1 |
-2.1 |
5.5 |
-1.2 |
-- |
0.0 |
-- |
-- |
-- |
-- |
| WILLIAMTOWN RAAF |
17.1 |
-1.5 |
4.6 |
-2.2 |
1.6 |
0.0 |
3.2 |
10.0 |
563 (23.5) |
39/08 |
| GOSFORD (NARARA RESEARCH STATION) AWS |
17.8 |
-1.2 |
3.9 |
-1.4 |
-- |
0.0 |
-- |
-- |
159 ( 6.6) |
24/01 |
| ORANGE AGRICULTURAL INSTITUTE |
8.2 |
-2.8 |
1.7 |
-0.4 |
0.3 |
0.0 |
0.0 |
6.9 |
-- |
-- |
| DUBBO AIRPORT AWS |
15.4 |
-2.1 |
4.2 |
+0.8 |
-- |
0.0 |
-- |
-- |
-- |
-- |
| SYDNEY AIRPORT AMO |
18.2 |
-0.1 |
8.0 |
-0.1 |
2.5 |
0.0 |
3.6 |
10.0 |
586 (24.4) |
46/10 |
| RICHMOND RAAF |
17.6 |
-2.2 |
-1.2 |
-5.6 |
-- |
0.0 |
-- |
-- |
255 (10.6) |
24/19 |
| BELLAMBI AWS |
17.6 |
-0.4 |
10.9 |
+0.4 |
-- |
0.0 |
-- |
-- |
610 (25.4) |
52/00 |
| CANBERRA AIRPORT |
12.8 |
-0.2 |
2.3 |
+1.3 |
-2.2 |
0.0 |
2.2 |
9.6 |
446 (18.6) |
35/14 |
| WAGGA WAGGA AMO |
12.9 |
-1.6 |
2.4 |
-1.2 |
2.0 |
0.0 |
2.0 |
3.0 |
268 (11.2) |
15/19 |
| ALBURY AIRPORT AWS |
13.7 |
-1.3 |
6.1 |
+2.3 |
-- |
0.2 |
-- |
-- |
164 ( 6.8) |
22/15 |
| MILDURA AIRPORT |
17.7 |
+0.5 |
3.6 |
-1.6 |
0.9 |
0.0 |
2.0 |
6.8 |
242 (10.1) |
39/13 |
| TATURA INST SUSTAINABLE AG |
13.7 |
-1.0 |
4.2 |
+0.3 |
-- |
0.2 |
-- |
-- |
193 ( 8.0) |
24/15 |
| BENDIGO AIRPORT |
12.9 |
-1.4 |
-0.4 |
-2.9 |
-- |
0.0 |
-- |
-- |
183 ( 7.6) |
�
31/15 |
| MELBOURNE REGIONAL OFFICE |
14.9 |
-0.1 |
7.9 |
+1.2 |
5.9 |
0.0 |
1.0 |
-- |
128 ( 5.3) |
24/13 |
| GEELONG AIRPORT |
15.1 |
+0.1 |
2.9 |
-3.0 |
-- |
1.4 |
-- |
-- |
330 (13.8) |
39/14 |
| BALLARAT AERODROME |
11.5 |
+0.1 |
2.1 |
-1.6 |
-- |
0.0 |
-- |
-- |
46 ( 1.9) |
44/13 |
| LAUNCESTON (TI TREE BEND) |
13.3 |
-0.4 |
-0.6 |
-4.2 |
-- |
0.0 |
-- |
-- |
110 ( 4.6) |
22/14 |
| HOBART AIRPORT |
14.0 |
+0.5 |
4.6 |
-0.1 |
1.8 |
0.0 |
1.8 |
9.3 |
391 (16.3) |
28/04 |
| |
Max
°
C |
+/- norm
°
C |
Min
°
C |
+/- norm
°
C |
Grass Min
°
C |
Rain to 9am mm |
Evaporation to 9am mm |
Sunshine hours |
Wind Run to 9am km |
Maximum Gust km/h / hour of occurrence |
|
| Hottest |
| Highest maximum temperature> | Greatest variation above normal maximum |
Highest minimum temperature | Greatest variation above normal minimum |
37.1 CURTIN AERO W Kimberley WA
36.0 WEST ROEBUCK W Kimberley WA
35.8 FITZROY CROSSING AERO W Kimberley WA
35.5 MANDORA E Pilbara WA
35.4 MCARTHUR RIVER MINE N Rivers NT
|
+7.5 : 30.1 ALICE SPRINGS AIRPORT N Plateau NT
+7.1 : 30.1 CURTIN SPRINGS N Plateau NT
+6.0 : 29.7 YULARA AERO N Plateau NT
+6.0 : 26.9 ERNABELLA (PUKATJA) NW Pastoral SA
|
26.0 NORTHERN ENDEAVOUR Islands ISL
24.5 COCOS ISLAND AIRPORT Islands ISL
23.4 COCONUT ISLAND N Peninsula QLD
23.1 HORN ISLAND N Peninsula QLD
22.7 WILLIS ISLAND Islands ISL
|
+5.7 : 12.0 MARLA POLICE STATION NW Pastoral SA
+5.3 : 12.5 CARNEGIE Interior WA
+4.5 : 10.2 CURTIN SPRINGS N Plateau NT
+4.4 : 11.9 NEWMAN AERO E Gascoyne WA
+4.3 : 10.3 ALICE SPRINGS AIRPORT N Plateau NT
|
| Coldest |
| Lowest maximum temperature | Greatest variation below normal maximum |
Lowest minimum temperature | Greatest variation below normal minimum |
-2.4 THREDBO AWS Snowy Mtns NSW
-2.4 MOUNT HOTHAM Upper NE VIC
-1.0 MOUNT BULLER Upper NE VIC
-0.7 FALLS CREEK Upper NE VIC
0.0 CHARLOTTE PASS (KOSCIUSKO CHALET) Snowy Mtns NSW
0.0 MOUNT BAW BAW W Gippsland VIC
0.0 MOUNT GININI AWS Goulburn/Monaro NSW
|
-4.9 : 15.0 MORAWA AIRPORT Central West WA
-4.8 : 16.6 LEINSTER AERO Goldfields WA
-4.7 : 15.1 PAYNES FIND E Gascoyne WA
-4.6 : 13.3 DALWALLINU Central West WA
-4.6 : 15.9 LAVERTON AERO Goldfields WA
|
-9.5 GLEN INNES AIRPORT AWS N Tablelands W NSW
-6.5 COOMA VISITORS CENTRE Goulburn/Monaro NSW
-6.5 TENTERFIELD (FEDERATION PARK) N Tablelands W NSW
-5.5 WOOLBROOK (DANGLEMAH ROAD) NW Slopes S NSW
-5.2 INVERELL (RAGLAN ST) N Tablelands W NSW
|
-8.4 : -9.5 GLEN INNES AIRPORT AWS N Tablelands W NSW
-8.4 : -6.5 TENTERFIELD (FEDERATION PARK) N Tablelands W NSW
-7.4 : -4.2 WARWICK Darling Downs E QLD
-7.0 : 2.2 MARYBOROUGH Brisbane/SE Coast QLD
-7.0 : -5.0 STANTHORPE LESLIE PARADE Darling Downs E QLD
-7.0 : -2.6 INVERELL RESEARCH CENTRE N Tablelands W NSW
|
|
Sunniest &
dullest |
Windiest |
Highest gusts |
Todays highest rainfall totals for the 24 hours to 9am. It
includes the top 5 totals nationally followed by all reported falls of 50mm or more. |
Highest
and lowest recordings of hours of sunshine for the 24 hours to midnight. |
Highest wind
run totals in kilometres for the 24 hours to 9am (average speed in brackets).
All reported runs >
=25km/h are shown. |
Highest wind
gusts in km/h for the 24 hours to midnight followed by the hour in which it occurred.
All stations with gusts >
89km/h are shown. |
43.2 RUDDS LANE TM Brisbane/SE Coast QLD
38.0 RUDDS LANE ALERT Brisbane/SE Coast QLD
32.8 BROGO (HAWKS HEAD ROAD) South Coast NSW
28.3 KARRI VALLEY RESORT Lower West WA
15.6 TASMAN ISLAND Southeast TAS
|
11.4 DARWIN AIRPORT N Rivers NT
11.1 GOVE AIRPORT N Rivers NT
11.0 TENNANT CREEK AIRPORT N Plateau NT
10.9 MACKAY M.O Central Coast E QLD
10.8 GILES METEOROLOGICAL OFFICE Interior WA
10.8 MOUNT ISA AERO Gulf Country QLD
.....
3.7 MOUNT GAMBIER AERO Lower SE SA
3.0 WAGGA WAGGA AMO SW Slopes S NSW
1.7 LAKE EILDON N Central VIC
0.6 COWRA RESEARCH CENTRE (EVANS ST) C Tablelands S NSW
**W** 0.0 WARWICK Darling Downs E QLD
|
1380 (57.5) NORFOLK ISLAND AERO Islands ISL
1209 (50.4) LORD HOWE ISLAND AERO Islands ISL
1198 (49.9) HOGAN ISLAND Islands ISL
946 (39.4) FLINDERS ISLAND AIRPORT Flinders Is/Bass St TAS
945 (39.4) MOUNT WELLINGTON Southeast TAS
939 (39.1) MAATSUYKER ISLAND LIGHTHOUSE Southeast TAS
916 (38.2) HARTZ MOUNTAIN (KEOGHS PIMPLE) Southeast TAS
886 (36.9) GREEN CAPE AWS South Coast NSW
863 (36.0) WILSONS PROMONTORY LIGHTHOUSE W Gippsland VIC
791 (33.0) CAPE LEEUWIN Lower West WA
773 (32.2) CAPE WILLOUGHBY Yorke Pen/Kanga Is SA
768 (32.0) MOUNT READ W Coast TAS
761 (31.7) CAPE GRIM BAPS N Coast TAS
752 (31.3) LOW HEAD N Coast TAS
748 (31.2) CAPE BRUNY (CAPE BRUNY) Southeast TAS
746 (31.1) NEPTUNE ISLAND W Agricultural SA
663 (27.6) ESPERANCE Lower West WA
658 (27.4) ESPERANCE AERO Lower West WA
653 (27.2) MCCLUER ISLAND N Rivers NT
621 (25.9) MOUNT BOYCE AWS C Tablelands S NSW
612 (25.5) THREDBO AWS Snowy Mtns NSW
610 (25.4) BELLAMBI AWS Illawarra NSW
610 (25.4) COLAC (MOUNT GELLIBRAND) W Coast VIC
606 (25.3) MONTAGUE ISLAND LIGHTHOUSE South Coast NSW
|
94/18 NEPTUNE ISLAND W Agricultural SA
74/09 CAPE WILLOUGHBY Yorke Pen/Kanga Is SA
74/18 CAPE BORDA Yorke Pen/Kanga Is SA
68/00 LORD HOWE ISLAND AERO Islands ISL
67/14 KALUMBURU N Kimberley WA
67/11 HINDMARSH ISLAND AWS Adelaide/Lofty SA
|
�