|
For notes on how to interpret
the data and quality control issues, see Daily Weather Summary Help.
**S** and **W** precede data flagged by the Bureau as suspicious or wrong
Data is as received at 03:12EST, 15/05/2012.
|
|
| |
Max
°
C |
+/- norm
°
C |
Min
°
C |
+/- norm
°
C |
Grass Min
°
C |
Rain to 9am mm |
Evaporation to 9am mm |
Sunshine hours |
Wind Run to 9am km (24-hour average km/h) |
Maximum Gust km/h / hour of occurrence |
| GERALDTON AIRPORT |
27.8 |
+3.4 |
5.6 |
-5.3 |
0.4 |
0.0 |
7.6 |
-- |
553 (23.0) |
54/16 |
| PERTH AIRPORT |
22.4 |
-0.1 |
6.8 |
-3.4 |
5.3 |
0.0 |
4.8 |
11.4 |
421 (17.5) |
52/08 |
| ALBANY AIRPORT |
15.9 |
-2.8 |
4.1 |
-5.0 |
2.6 |
0.0 |
1.8 |
6.8 |
208 ( 8.7) |
26/13 |
| BUNBURY |
20.9 |
+0.2 |
7.6 |
-1.6 |
-- |
0.0 |
-- |
-- |
185 ( 7.7) |
31/16 |
| MANDURAH |
21.3 |
-- |
10.0 |
-- |
-- |
0.0 |
-- |
-- |
266 (11.1) |
37/16 |
| DARWIN AIRPORT |
34.0 |
+0.8 |
26.7 |
+1.7 |
26.5 |
0.0 |
7.6 |
10.3 |
417 (17.4) |
57/22 |
| ALICE SPRINGS AIRPORT |
23.2 |
-7.8 |
15.5 |
+0.7 |
14.4 |
0.0 |
13.6 |
3.0 |
461 (19.2) |
39/11 |
| WHYALLA AERO |
16.4 |
-7.5 |
11.0 |
+0.5 |
-- |
0.0 |
-- |
-- |
462 (19.3) |
37/15 |
| ADELAIDE (KENT TOWN) |
16.4 |
-5.4 |
-- |
-- |
-- |
2.84 |
14.0 |
3.9 |
-- |
-- |
| MOUNT GAMBIER AERO |
14.1 |
-3.8 |
7.8 |
+0.7 |
5.8 |
0.6 |
3.2 |
4.9 |
508 (21.2) |
46/13 |
| MOUNT ISA AERO |
36.3 |
+1.7 |
22.1 |
+3.5 |
20.3 |
0.0 |
15.8 |
11.3 |
606 (25.3) |
54/00 |
| CAIRNS AERO |
29.6 |
+0.1 |
21.7 |
+1.1 |
20.0 |
0.0 |
6.0 |
10.9 |
333 (13.9) |
28/12 |
| TOWNSVILLE AERO |
31.3 |
+1.9 |
20.5 |
-0.2 |
18.4 |
0.0 |
8.6 |
10.8 |
309 (12.9) |
30/11 |
| MACKAY M.O |
30.6 |
+3.0 |
20.0 |
+0.3 |
-- |
0.0 |
-- |
11.0 |
288 (12.0) |
28/12 |
| ROCKHAMPTON AERO |
34.4 |
+4.7 |
17.9 |
+0.9 |
16.5 |
0.0 |
7.4 |
-- |
215 ( 9.0) |
30/15 |
| BUNDABERG AERO |
31.8 |
+4.9 |
18.0 |
+1.4 |
-- |
0.0 |
7.2 |
-- |
493 (20.5) |
-- |
| NAMBOUR DPI |
27.0 |
+0.3 |
15.0 |
+1.2 |
-- |
0.0 |
-- |
-- |
-- |
-- |
| COOLANGATTA |
23.6 |
-0.8 |
14.5 |
-1.7 |
-- |
0.0 |
-- |
-- |
395 (16.5) |
50/09 |
| BRISBANE AERO |
24.2 |
-1.3 |
17.2 |
+1.5 |
11.3 |
0.0 |
5.8 |
11.6 |
493 (20.5) |
39/08 |
| TOOWOOMBA AIRPORT |
24.3 |
-0.4 |
11.1 |
-1.7 |
-- |
0.0 |
-- |
-- |
659 (27.5) |
39/00 |
| GUNNEDAH RESOURCE CENTRE |
19.7 |
-5.4 |
6.6 |
-5.5 |
2.5 |
8.6 |
3.8 |
-- |
274 (11.4) |
-- |
| COFFS HARBOUR MO |
19.4 |
-4.2 |
12.3 |
-1.5 |
4.5 |
0.4 |
3.0 |
11.8 |
351 (14.6) |
35/01 |
| PORT MACQUARIE AIRPORT AWS |
19.8 |
-4.2 |
7.7 |
-4.2 |
-- |
9.0 |
-- |
-- |
-- |
-- |
| WILLIAMTOWN RAAF |
20.8 |
-2.8 |
8.1 |
-3.9 |
6.0 |
15.0 |
5.4 |
11.8 |
522 (21.8) |
43/14 |
| GOSFORD (NARARA RESEARCH STATION) AWS |
-- |
-- |
-- |
-- |
-- |
-- |
-- |
-- |
-- |
-- |
| ORANGE AGRICULTURAL INSTITUTE |
11.2 |
-6.3 |
1.0 |
-5.6 |
-1.0 |
3.2 |
2.6 |
11.3 |
-- |
-- |
| DUBBO AIRPORT AWS |
16.9 |
-7.9 |
3.6 |
-5.8 |
-- |
0.0 |
-- |
-- |
-- |
-- |
| SYDNEY AIRPORT AMO |
20.6 |
-1.9 |
8.4 |
-4.7 |
3.6 |
1.8 |
3.4 |
11.7 |
540 (22.5) |
44/23 |
| RICHMOND RAAF |
21.5 |
-3.5 |
4.6 |
-6.4 |
-- |
0.2 |
-- |
-- |
337 (14.0) |
34/17 |
| BELLAMBI AWS |
17.0 |
-4.6 |
9.2 |
-4.7 |
-- |
0.6 |
-- |
-- |
474 (19.8) |
41/23 |
| CANBERRA AIRPORT |
16.0 |
-3.4 |
0.3 |
-5.8 |
-3.7 |
8.2 |
5.4 |
11.8 |
393 (16.4) |
57/14 |
| WAGGA WAGGA AMO |
15.5 |
-5.9 |
2.5 |
-5.2 |
-0.7 |
1.2 |
2.4 |
10.5 |
413 (17.2) |
44/15 |
| ALBURY AIRPORT AWS |
13.9 |
-7.7 |
2.7 |
-5.3 |
-- |
1.0 |
-- |
-- |
340 (14.2) |
35/12 |
| MILDURA AIRPORT |
18.1 |
-5.7 |
3.4 |
-6.4 |
0.8 |
0.0 |
6.6 |
11.3 |
468 (19.5) |
39/09 |
| TATURA INST SUSTAINABLE AG |
14.5 |
-6.4 |
2.4 |
-5.1 |
-- |
1.0 |
4.4 |
-- |
461 (19.2) |
34/11 |
| BENDIGO AIRPORT |
14.3 |
-6.0 |
1.4 |
-4.9 |
-- |
0.8 |
-- |
-- |
391 (16.3) |
�
34/14 |
| MELBOURNE REGIONAL OFFICE |
16.0 |
-3.6 |
8.0 |
-1.5 |
4.9 |
2.0 |
2.2 |
-- |
196 ( 8.2) |
24/10 |
| GROVEDALE (GEELONG AIRPORT) |
15.6 |
-3.2 |
6.0 |
-1.6 |
-- |
3.4 |
-- |
-- |
488 (20.3) |
55/13 |
| BALLARAT AERODROME |
11.2 |
-5.4 |
3.1 |
-3.1 |
-- |
1.6 |
-- |
-- |
467 (19.5) |
46/11 |
| LAUNCESTON (TI TREE BEND) |
16.8 |
-1.2 |
1.8 |
-5.1 |
-- |
0.0 |
-- |
-- |
207 ( 8.6) |
54/12 |
| HOBART AIRPORT |
16.1 |
-1.2 |
5.6 |
-1.9 |
0.4 |
0.6 |
3.6 |
8.5 |
669 (27.9) |
74/15 |
| |
Max
°
C |
+/- norm
°
C |
Min
°
C |
+/- norm
°
C |
Grass Min
°
C |
Rain to 9am mm |
Evaporation to 9am mm |
Sunshine hours |
Wind Run to 9am km |
Maximum Gust km/h / hour of occurrence |
|
| Hottest |
| Highest maximum temperature> | Greatest variation above normal maximum |
Highest minimum temperature | Greatest variation above normal minimum |
41.2 MANDORA E Pilbara WA
40.6 CURTIN AERO W Kimberley WA
40.2 PARDOO STATION E Pilbara WA
40.2 DOUGLAS RIVER N Rivers NT
40.2 JULIA CREEK AIRPORT Gulf Country QLD
|
+5.5 : 41.2 MANDORA E Pilbara WA
+5.5 : 31.4 CARNARVON AIRPORT W Gascoyne WA
+5.2 : 38.1 BROOME AIRPORT W Kimberley WA
|
29.0 NORTHERN ENDEAVOUR Islands ISL
28.4 FITZROY CROSSING AERO W Kimberley WA
27.6 DELAMERE WEAPONS RANGE N Rivers NT
27.4 WYNDHAM N Kimberley WA
27.4 ARGYLE AERODROME E Kimberley WA
|
+7.4 : 25.4 RICHMOND POST OFFICE Upper Carpentaria QLD
+5.9 : 24.9 RICHMOND AIRPORT Upper Carpentaria QLD
**S** +5.9 : 19.9 MURWILLUMBAH (BRAY PARK) North Coast NSW
+5.5 : 28.4 FITZROY CROSSING AERO W Kimberley WA
+4.9 : 26.0 BURKETOWN POST OFFICE Gulf Country QLD
+4.9 : 19.8 ROLLESTON Central Highlands QLD
+4.9 : 20.2 SPRINGSURE DAME ST Central Highlands QLD
+4.9 : 19.7 BRIGALOW RESEARCH STN Central Highlands QLD
|
| Coldest |
| Lowest maximum temperature | Greatest variation below normal maximum |
Lowest minimum temperature | Greatest variation below normal minimum |
-0.3 MOUNT BULLER Upper NE VIC
0.0 MT BAW BAW W Gippsland VIC
0.9 MT HOTHAM Upper NE VIC
1.0 MOUNT WELLINGTON Southeast TAS
2.0 MOUNT READ W Coast TAS
|
-17.8 : 19.6 RABBIT FLAT N Plateau NT
-12.5 : 24.7 LAJAMANU N Rivers NT
-10.9 : 22.4 TERRITORY GRAPE FARM N Plateau NT
-10.5 : 24.7 ALI CURUNG N Plateau NT
-9.9 : 23.2 YUENDUMU N Plateau NT
|
-7.6 THREDBO AWS Snowy Mtns NSW
-6.7 MOUNT HOTHAM Upper NE VIC
-6.5 PERISHER VALLEY SKI CENTRE Snowy Mtns NSW
-5.7 FALLS CREEK Upper NE VIC
-5.6 CHARLOTTE PASS (KOSCIUSKO CHALET) Snowy Mtns NSW
-5.6 DINNER PLAIN (MOUNT HOTHAM AIRPORT) Upper NE VIC
|
-8.9 : -2.9 YONGALA Upper North SA
-8.6 : 0.0 GLUEPOT RESERVE (GLUEPOT) Northeast SA
-8.1 : -1.9 RUTHERGLEN RESEARCH Lower NE VIC
-8.1 : -5.6 DINNER PLAIN (MOUNT HOTHAM AIRPORT) Upper NE VIC
-8.0 : 0.9 YUNTA AIRSTRIP Northeast SA
-8.0 : -4.1 CABRAMURRA SMHEA AWS SW Slopes S NSW
|
|
Sunniest &
dullest |
Windiest |
Highest gusts |
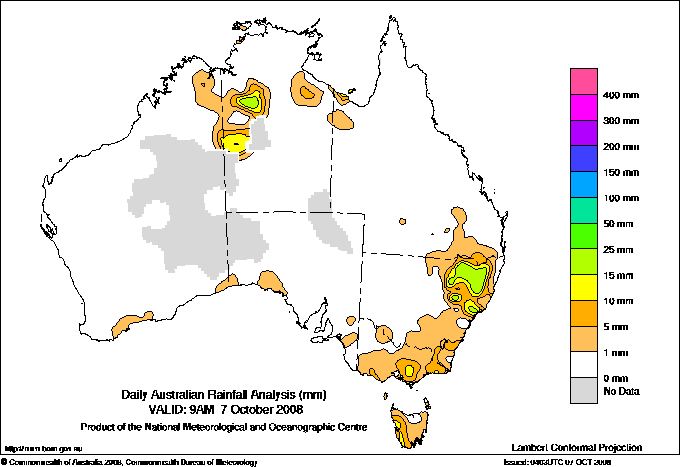
Todays highest rainfall totals for the 24 hours to 9am. It
includes the top 5 totals nationally followed by all reported falls of 50mm or more. |
Highest
and lowest recordings of hours of sunshine for the 24 hours to midnight. |
Highest wind
run totals in kilometres for the 24 hours to 9am (average speed in brackets).
All reported runs >
=25km/h are shown. |
Highest wind
gusts in km/h for the 24 hours to midnight followed by the hour in which it occurred.
All stations with gusts >
89km/h are shown. |
40.4 ATTUNGA (MINDEROO) NW Slopes S NSW
40.2 ATTUNGA (GARTHOWEN) NW Slopes S NSW
40.0 POKOLBIN (BEN EAN) Hunter Valley NSW
39.2 NUNDLE (KEEVA) NW Slopes S NSW
38.0 BLACK SPRINGS FORESTRY C Tablelands S NSW
|
11.8 MOREE AERO NW Plains E NSW
11.8 COFFS HARBOUR MO MidNorth Coast N NSW
11.8 WILLIAMTOWN RAAF Hunter Valley NSW
11.8 CANBERRA AIRPORT Goulburn/Monaro NSW
11.7 WOOMERA AERODROME NW Pastoral SA
11.7 SYDNEY AIRPORT AMO Sydney--east NSW
.....
2.4 TENNANT CREEK AIRPORT N Plateau NT
2.2 BUNDOORA (LATROBE UNIVERSITY) E Central VIC
1.9 LOXTON RESEARCH CENTRE Murray Valley SA
0.3 LAKE EILDON N Central VIC
0.0 RABBIT FLAT N Plateau NT
|
1436 (59.8) MAATSUYKER ISLAND LIGHTHOUSE Southeast TAS
1323 (55.1) HOGAN ISLAND Islands ISL
1315 (54.8) WILSONS PROMONTORY LIGHTHOUSE W Gippsland VIC
1296 (54.0) CAPE GRIM BAPS N Coast TAS
1254 (52.3) MOUNT WELLINGTON Southeast TAS
1152 (48.0) GABO ISLAND LIGHTHOUSE E Gippsland VIC
966 (40.3) GREEN CAPE AWS South Coast NSW
956 (39.8) HARTZ MOUNTAIN (KEOGHS PIMPLE) Southeast TAS
910 (37.9) NORTH ISLAND Central West WA
862 (35.9) CAPE OTWAY LIGHTHOUSE W Coast VIC
853 (35.5) MOUNT READ W Coast TAS
843 (35.1) FLINDERS ISLAND AIRPORT Flinders Is/Bass St TAS
832 (34.7) LOW HEAD N Coast TAS
822 (34.3) CAPE BRUNY (CAPE BRUNY) Southeast TAS
818 (34.1) SCOTTS PEAK DAM W Coast TAS
788 (32.8) CARNARVON AIRPORT W Gascoyne WA
772 (32.2) KING ISLAND AIRPORT King Island TAS
760 (31.7) PORT FAIRY AWS W Coast VIC
746 (31.1) BOMBALA AWS Goulburn/Monaro NSW
730 (30.4) COLAC (MOUNT GELLIBRAND) W Coast VIC
720 (30.0) TASMAN ISLAND Southeast TAS
719 (30.0) LORD HOWE ISLAND AERO Islands ISL
717 (29.9) COCOS ISLAND AIRPORT Islands ISL
682 (28.4) CAPE JAFFA (THE LIMESTONE) Lower SE SA
678 (28.3) MOUNT BOYCE AWS C Tablelands S NSW
673 (28.0) MOUNT HOTHAM Upper NE VIC
669 (27.9) HOBART AIRPORT Southeast TAS
664 (27.7) MOUNT BULLER Upper NE VIC
664 (27.7) LIAWENEE Central Plateau TAS
662 (27.6) CAPE MORETON LIGHTHOUSE Brisbane/SE Coast QLD
659 (27.5) TOOWOOMBA AIRPORT Darling Downs E QLD
642 (26.8) SHARK BAY AIRPORT W Gascoyne WA
641 (26.7) MURRURUNDI GAP AWS Hunter Valley NSW
632 (26.3) CAPE NELSON LIGHTHOUSE W Coast VIC
622 (25.9) WILLIS ISLAND Islands ISL
615 (25.6) THE MONUMENT AIRPORT Northwest QLD
613 (25.5) ARMIDALE AIRPORT AWS N Tablelands W NSW
611 (25.5) SMITHTON AERODROME N Coast TAS
607 (25.3) GOULBURN AIRPORT AWS Goulburn/Monaro NSW
606 (25.3) MOUNT ISA AERO Gulf Country QLD
600 (25.0) TENNANT CREEK AIRPORT N Plateau NT
|
143/18 MOUNT WELLINGTON Southeast TAS
115/15 MAATSUYKER ISLAND LIGHTHOUSE Southeast TAS
109/13 CAPE BRUNY (CAPE BRUNY) Southeast TAS
102/15 HOGAN ISLAND Islands ISL
94/15 WILSONS PROMONTORY LIGHTHOUSE W Gippsland VIC
94/08 CAPE GRIM BAPS N Coast TAS
94/10 MOUNT READ W Coast TAS
93/19 TASMAN ISLAND Southeast TAS
91/08 SCOTTS PEAK DAM W Coast TAS
|
�