|
For notes on how to interpret
the data and quality control issues, see Daily Weather Summary Help.
**S** and **W** precede data flagged by the Bureau as suspicious or wrong
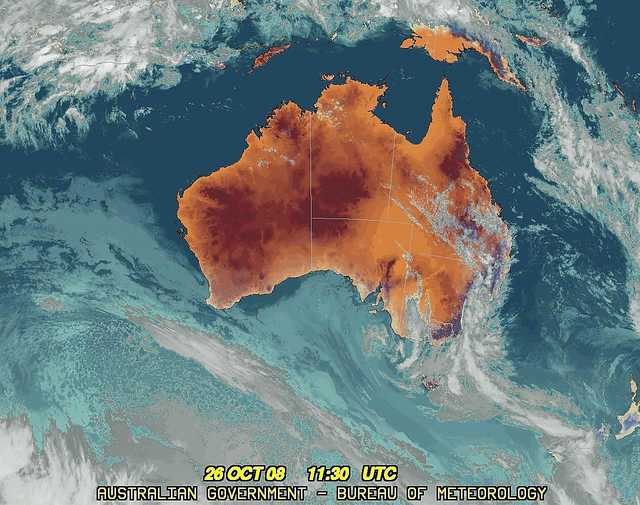
Data is as received at 03:18EST, 15/05/2012.
|
|
| |
Max
°
C |
+/- norm
°
C |
Min
°
C |
+/- norm
°
C |
Grass Min
°
C |
Rain to 9am mm |
Evaporation to 9am mm |
Sunshine hours |
Wind Run to 9am km (24-hour average km/h) |
Maximum Gust km/h / hour of occurrence |
| GERALDTON AIRPORT |
24.3 |
-0.1 |
9.1 |
-1.8 |
5.1 |
0.0 |
6.0 |
-- |
350 (14.6) |
39/17 |
| PERTH AIRPORT |
21.6 |
-0.9 |
7.0 |
-3.2 |
7.2 |
0.0 |
4.8 |
11.4 |
333 (13.9) |
37/15 |
| ALBANY AIRPORT |
20.3 |
+1.6 |
11.3 |
+2.2 |
10.0 |
0.0 |
4.4 |
9.6 |
349 (14.5) |
34/15 |
| BUNBURY |
20.3 |
-0.4 |
6.2 |
-3.0 |
-- |
0.2 |
-- |
-- |
241 (10.0) |
24/14 |
| MANDURAH |
20.3 |
-- |
11.6 |
-- |
-- |
0.0 |
-- |
-- |
314 (13.1) |
30/12 |
| DARWIN AIRPORT |
33.8 |
+0.6 |
26.0 |
+1.0 |
25.1 |
0.0 |
-- |
11.3 |
349 (14.5) |
34/15 |
| ALICE SPRINGS AIRPORT |
35.2 |
+4.2 |
23.5 |
+8.7 |
21.0 |
0.0 |
14.4 |
10.0 |
385 (16.0) |
37/01 |
| WHYALLA AERO |
28.1 |
+4.2 |
17.4 |
+6.9 |
-- |
0.0 |
-- |
-- |
659 (27.5) |
63/23 |
| ADELAIDE (KENT TOWN) |
23.7 |
+1.9 |
17.1 |
+5.7 |
-- |
0.0 |
-- |
6.9 |
320 (13.3) |
50/15 |
| MOUNT GAMBIER AERO |
29.8 |
+11.9 |
14.8 |
+7.7 |
13.9 |
0.0 |
10.4 |
4.1 |
410 (17.1) |
61/09 |
| MOUNT ISA AERO |
39.0 |
+4.4 |
15.4 |
-3.2 |
13.6 |
0.0 |
10.2 |
12.0 |
206 ( 8.6) |
34/12 |
| CAIRNS AERO |
30.0 |
+0.5 |
18.9 |
-1.7 |
17.0 |
0.0 |
8.0 |
11.0 |
376 (15.7) |
44/16 |
| TOWNSVILLE AERO |
29.4 |
0.0 |
18.1 |
-2.6 |
17.3 |
0.0 |
9.8 |
11.9 |
405 (16.9) |
39/11 |
| MACKAY M.O |
28.7 |
+1.1 |
16.7 |
-3.0 |
-- |
0.0 |
-- |
11.2 |
-- |
-- |
| ROCKHAMPTON AERO |
29.6 |
-0.1 |
14.7 |
-2.3 |
12.8 |
0.0 |
6.0 |
-- |
250 (10.4) |
34/16 |
| BUNDABERG AERO |
26.3 |
-0.6 |
-- |
-- |
-- |
0.0 |
6.2 |
-- |
-- |
-- |
| NAMBOUR DPI |
25.0 |
-1.7 |
13.0 |
-0.8 |
-- |
5.0 |
-- |
-- |
-- |
-- |
| COOLANGATTA |
24.7 |
+0.3 |
12.5 |
-3.7 |
-- |
4.2 |
-- |
-- |
172 ( 7.2) |
31/14 |
| BRISBANE AERO |
25.1 |
-0.4 |
14.2 |
-1.5 |
11.7 |
0.8 |
4.8 |
10.2 |
326 (13.6) |
35/12 |
| TOOWOOMBA AIRPORT |
24.7 |
0.0 |
13.1 |
+0.3 |
-- |
0.0 |
-- |
-- |
478 (19.9) |
43/13 |
| GUNNEDAH RESOURCE CENTRE |
28.7 |
+3.6 |
10.6 |
-1.5 |
5.7 |
0.0 |
6.2 |
-- |
99 ( 4.1) |
-- |
| COFFS HARBOUR MO |
23.4 |
-0.2 |
12.0 |
-1.8 |
7.9 |
0.0 |
4.6 |
11.3 |
319 (13.3) |
55/14 |
| PORT MACQUARIE AIRPORT AWS |
25.5 |
+1.5 |
8.2 |
-3.7 |
-- |
0.0 |
-- |
-- |
-- |
-- |
| WILLIAMTOWN RAAF |
29.6 |
+6.0 |
8.8 |
-3.2 |
6.9 |
0.0 |
6.0 |
9.6 |
270 (11.3) |
28/17 |
| GOSFORD (NARARA RESEARCH STATION) AWS |
28.6 |
+4.9 |
8.3 |
-2.4 |
-- |
0.0 |
-- |
-- |
73 ( 3.0) |
21/13 |
| ORANGE AGRICULTURAL INSTITUTE |
21.5 |
+4.0 |
11.0 |
+4.4 |
3.0 |
0.0 |
4.8 |
5.2 |
-- |
-- |
| DUBBO AIRPORT AWS |
27.6 |
+2.8 |
9.8 |
+0.4 |
-- |
0.0 |
-- |
-- |
-- |
-- |
| SYDNEY AIRPORT AMO |
27.6 |
+5.1 |
14.3 |
+1.2 |
9.8 |
0.0 |
8.0 |
8.7 |
397 (16.5) |
50/17 |
| RICHMOND RAAF |
29.8 |
+4.8 |
8.2 |
-2.8 |
-- |
0.0 |
-- |
-- |
99 ( 4.1) |
35/13 |
| BELLAMBI AWS |
25.3 |
+3.7 |
15.0 |
+1.1 |
-- |
0.0 |
-- |
-- |
226 ( 9.4) |
43/11 |
| CANBERRA AIRPORT |
26.1 |
+6.7 |
7.9 |
+1.8 |
3.4 |
0.0 |
6.8 |
3.5 |
204 ( 8.5) |
43/09 |
| WAGGA WAGGA AMO |
33.5 |
+12.1 |
15.5 |
+7.8 |
12.6 |
0.0 |
9.2 |
2.9 |
305 (12.7) |
46/22 |
| ALBURY AIRPORT AWS |
27.4 |
+5.8 |
11.2 |
+3.2 |
-- |
0.0 |
-- |
-- |
161 ( 6.7) |
31/11 |
| MILDURA AIRPORT |
37.6 |
+13.8 |
21.0 |
+11.2 |
17.4 |
0.0 |
10.8 |
6.1 |
275 (11.5) |
72/14 |
| TATURA INST SUSTAINABLE AG |
30.0 |
+9.1 |
17.6 |
+10.1 |
-- |
0.0 |
-- |
-- |
252 (10.5) |
44/11 |
| BENDIGO AIRPORT |
31.2 |
+10.9 |
16.6 |
+10.3 |
-- |
0.0 |
-- |
-- |
231 ( 9.6) |
�
46/13 |
| MELBOURNE REGIONAL OFFICE |
30.5 |
+10.9 |
21.5 |
+12.0 |
17.8 |
0.0 |
8.6 |
-- |
193 ( 8.0) |
34/17 |
| GROVEDALE (GEELONG AIRPORT) |
31.3 |
+12.5 |
16.4 |
+8.8 |
-- |
0.0 |
-- |
-- |
214 ( 8.9) |
55/15 |
| BALLARAT AERODROME |
29.7 |
+13.1 |
16.1 |
+9.9 |
-- |
0.0 |
-- |
-- |
555 (23.1) |
57/14 |
| LAUNCESTON (TI TREE BEND) |
23.5 |
+5.5 |
9.9 |
+3.0 |
-- |
0.0 |
-- |
-- |
208 ( 8.7) |
30/13 |
| HOBART AIRPORT |
26.4 |
+9.1 |
13.4 |
+5.9 |
7.8 |
0.0 |
4.6 |
9.0 |
488 (20.3) |
43/23 |
| |
Max
°
C |
+/- norm
°
C |
Min
°
C |
+/- norm
°
C |
Grass Min
°
C |
Rain to 9am mm |
Evaporation to 9am mm |
Sunshine hours |
Wind Run to 9am km |
Maximum Gust km/h / hour of occurrence |
|
| Hottest |
| Highest maximum temperature> | Greatest variation above normal maximum |
Highest minimum temperature | Greatest variation above normal minimum |
42.2 FITZROY CROSSING AERO W Kimberley WA
41.6 BALGO HILLS Interior WA
41.5 RABBIT FLAT N Plateau NT
41.4 VICTORIA RIVER DOWNS N Rivers NT
41.3 WARMUN E Kimberley WA
41.3 BRADSHAW N Rivers NT
41.3 ELLIOTT N Plateau NT
|
+15.5 : 33.3 MORTLAKE RACECOURSE W Coast VIC
+15.1 : 32.7 HAMILTON AIRPORT W Coast VIC
+14.4 : 37.5 WALPEUP RESEARCH Mallee N VIC
+14.4 : 32.1 WARRNAMBOOL AIRPORT NDB W Coast VIC
+14.2 : 27.0 LOOKOUT HILL Western Plains VIC
+14.2 : 30.8 COLAC (MT GELLIBRAND) W Coast VIC
|
29.0 NORTHERN ENDEAVOUR Islands ISL
28.2 DUM IN MIRRIE AWS N Rivers NT
27.9 PORT KEATS AERO N Rivers NT
27.6 BRADSHAW N Rivers NT
27.4 MCCLUER ISLAND N Rivers NT
27.4 WARRUWI N Rivers NT
|
+16.5 : 24.8 LOXTON RESEARCH CENTRE Murray Valley SA
+15.8 : 24.5 RENMARK AERO Murray Valley SA
+15.2 : 23.0 LAMEROO COMPARISON Mallee/Upper SE SA
+13.9 : 22.5 GLUEPOT RESERVE (GLUEPOT) Northeast SA
+13.8 : 22.6 WALPEUP RESEARCH Mallee N VIC
|
| Coldest |
| Lowest maximum temperature | Greatest variation below normal maximum |
Lowest minimum temperature | Greatest variation below normal minimum |
14.0 MOUNT LOFTY Adelaide/Lofty SA
16.5 CAPE BORDA AWS Yorke Pen/Kanga Is SA
17.2 MOUNT BULLER Upper NE VIC
17.6 THREDBO AWS Snowy Mtns NSW
17.7 MT BAW BAW W Gippsland VIC
|
-3.7 : 20.7 NULLARBOR W Agricultural SA
-3.2 : 23.9 FORREST Eucla WA
-2.9 : 18.1 ESPERANCE Lower West WA
-2.9 : 20.1 EUCLA Eucla WA
-2.9 : 20.0 EYRE Eucla WA
|
0.0 TIDBINBILLA NATURE RESERVE Goulburn/Monaro NSW
1.3 GLEN INNES AIRPORT AWS N Tablelands W NSW
1.7 ARMIDALE (TREE GROUP NURSERY) N Tablelands W NSW
2.0 WOOLBROOK (DANGLEMAH ROAD) NW Slopes S NSW
2.4 TENTERFIELD (FEDERATION PARK) N Tablelands W NSW
|
-6.7 : 12.0 RABBIT FLAT N Plateau NT
-6.0 : 0.0 TIDBINBILLA NATURE RESERVE Goulburn/Monaro NSW
-5.9 : 7.9 ROMA AIRPORT Maranoa QLD
|
|
Sunniest &
dullest |
Windiest |
Highest gusts |
Todays highest rainfall totals for the 24 hours to 9am. It
includes the top 5 totals nationally followed by all reported falls of 50mm or more. |
Highest
and lowest recordings of hours of sunshine for the 24 hours to midnight. |
Highest wind
run totals in kilometres for the 24 hours to 9am (average speed in brackets).
All reported runs >
=25km/h are shown. |
Highest wind
gusts in km/h for the 24 hours to midnight followed by the hour in which it occurred.
All stations with gusts >
89km/h are shown. |
32.0 ARUBIDDY Eucla WA
26.0 MORDETTA Cent Wheatbelt WA
22.4 EYRE Eucla WA
21.4 MUNDRABILLA STATION Eucla WA
21.2 BOONDALL Brisbane/SE Coast QLD
|
12.6 GILES METEOROLOGICAL OFFICE Interior WA
12.5 TENNANT CREEK AIRPORT N Plateau NT
12.1 RABBIT FLAT N Plateau NT
12.0 MOUNT ISA AERO Gulf Country QLD
11.9 GOVE AIRPORT N Rivers NT
11.9 TOWNSVILLE AERO N Coast--Herbert QLD
.....
1.2 EAST SALE AIRPORT W Gippsland VIC
0.7 BICHENO (COUNCIL DEPOT) E Coast TAS
0.6 LAKE EILDON N Central VIC
**S** 0.0 WARWICK Darling Downs E QLD
0.0 SCOTTSDALE (WEST MINSTONE ROAD) N Coast TAS
|
1178 (49.1) MOUNT WELLINGTON Southeast TAS
933 (38.9) MOUNT READ W Coast TAS
870 (36.3) TASMAN ISLAND Southeast TAS
858 (35.8) COOBER PEDY AIRPORT NW Pastoral SA
855 (35.6) CAPE WILLOUGHBY Yorke Pen/Kanga Is SA
838 (34.9) VARANUS ISLAND Islands ISL
807 (33.6) GABO ISLAND LIGHTHOUSE E Gippsland VIC
803 (33.5) TARCOOLA AERO NW Pastoral SA
802 (33.4) MELBOURNE AIRPORT E Central VIC
775 (32.3) WOOMERA AERODROME NW Pastoral SA
772 (32.2) BARROW ISLAND AIRPORT W Pilbara WA
769 (32.0) CEDUNA AMO W Agricultural SA
721 (30.0) CAPE GRIM BAPS N Coast TAS
704 (29.3) FLINDERS ISLAND AIRPORT Flinders Is/Bass St TAS
703 (29.3) WILLIS ISLAND Islands ISL
700 (29.2) ROXBY DOWNS (OLYMPIC DAM AERODROME) NW Pastoral SA
699 (29.1) WALLAN (KILMORE GAP) N Central VIC
696 (29.0) PORT AUGUSTA AERO W Agricultural SA
684 (28.5) MOUNT HOTHAM Upper NE VIC
678 (28.3) OODNADATTA AIRPORT NE Pastoral SA
672 (28.0) ROSEWORTHY AWS Adelaide/Lofty SA
665 (27.7) THREDBO AWS Snowy Mtns NSW
662 (27.6) THEVENARD ISLAND W Pilbara WA
661 (27.5) SNOWTOWN (RAYVILLE PARK) Lower North SA
659 (27.5) WHYALLA AERO W Agricultural SA
654 (27.3) CARNARVON AIRPORT W Gascoyne WA
654 (27.3) NEPTUNE ISLAND W Agricultural SA
638 (26.6) CAPE FLATTERY N Coast--Barron QLD
635 (26.5) GILES METEOROLOGICAL OFFICE Interior WA
624 (26.0) TUNNACK FIRE STATION Southeast TAS
623 (26.0) HORN ISLAND N Peninsula QLD
623 (26.0) LIAWENEE Central Plateau TAS
622 (25.9) GREEN CAPE AWS South Coast NSW
621 (25.9) NORTH SHIELDS (PORT LINCOLN AWS) W Agricultural SA
621 (25.9) WILSONS PROMONTORY LIGHTHOUSE W Gippsland VIC
615 (25.6) HOGAN ISLAND Islands ISL
611 (25.5) KARRATHA AERO E Pilbara WA
605 (25.2) MINNIPA DPI W Agricultural SA
604 (25.2) NULLARBOR W Agricultural SA
600 (25.0) MAATSUYKER ISLAND LIGHTHOUSE Southeast TAS
|
111/23 MOUNT WELLINGTON Southeast TAS
96/02 HARTZ MOUNTAIN (KEOGHS PIMPLE) Southeast TAS
94/22 MOUNT HOTHAM Upper NE VIC
94/00 SCOTTS PEAK DAM W Coast TAS
93/01 MAATSUYKER ISLAND LIGHTHOUSE Southeast TAS
91/17 SWAN HILL AERODROME Mallee S VIC
|
�