|
For notes on how to interpret
the data and quality control issues, see Daily Weather Summary Help.
**S** and **W** precede data flagged by the Bureau as suspicious or wrong
Data is as received at 01:24EST, 20/04/2013.
|
|
| |
Max
°
C |
+/- norm
°
C |
Min
°
C |
+/- norm
°
C |
Grass Min
°
C |
Rain to 9am mm |
Evaporation to 9am mm |
Sunshine hours |
Wind Run to 9am km (24-hour average km/h) |
Maximum Gust km/h / hour of occurrence |
| GERALDTON AIRPORT COMPARISON |
19.9 |
-1.0 |
9.9 |
-1.1 |
-- |
0.0 |
-- |
-- |
197 ( 8.2) |
28/12 |
| PERTH AIRPORT |
17.7 |
-1.2 |
6.3 |
-2.7 |
4.9 |
1.4 |
1.4 |
2.4 |
254 (10.6) |
21/08 |
| ALBANY AIRPORT COMPARISON |
14.9 |
-1.7 |
7.1 |
-1.0 |
-- |
4.6 |
-- |
-- |
247 (10.3) |
22/22 |
| BUNBURY |
17.1 |
-1.3 |
7.1 |
-0.9 |
-- |
0.2 |
-- |
-- |
113 ( 4.7) |
18/19 |
| MANDURAH |
16.8 |
-1.8 |
10.1 |
-1.4 |
-- |
0.4 |
-- |
-- |
190 ( 7.9) |
11/13 |
| DARWIN AIRPORT |
31.3 |
+0.7 |
16.4 |
-3.5 |
14.4 |
0.0 |
5.8 |
10.9 |
319 (13.3) |
28/10 |
| ALICE SPRINGS AIRPORT |
20.9 |
+1.1 |
1.9 |
-3.1 |
-0.1 |
0.0 |
3.8 |
10.1 |
200 ( 8.3) |
31/11 |
| WHYALLA AERO |
17.5 |
+0.2 |
7.4 |
+1.3 |
-- |
0.0 |
3.8 |
-- |
462 (19.3) |
52/17 |
| ADELAIDE (KENT TOWN) |
14.5 |
-1.6 |
8.9 |
+0.8 |
-- |
6.4 |
1.6 |
-- |
-- |
61/14 |
| MOUNT GAMBIER AERO |
13.3 |
-0.5 |
5.8 |
+0.1 |
6.9 |
14.6 |
2.0 |
4.3 |
574 (23.9) |
48/12 |
| MOUNT ISA AERO |
25.9 |
+1.1 |
3.7 |
-6.3 |
-- |
0.0 |
-- |
-- |
245 (10.2) |
31/16 |
| CAIRNS AERO |
27.1 |
+1.1 |
21.1 |
+3.3 |
20.4 |
0.0 |
4.0 |
3.7 |
279 (11.6) |
22/03 |
| TOWNSVILLE AERO |
24.6 |
-1.0 |
19.5 |
+4.9 |
18.4 |
0.0 |
3.0 |
7.9 |
249 (10.4) |
24/13 |
| MACKAY M.O |
22.1 |
+0.2 |
12.2 |
-1.8 |
-- |
0.0 |
-- |
10.4 |
266 (11.1) |
21/02 |
| ROCKHAMPTON AERO |
24.5 |
+1.0 |
11.8 |
+0.9 |
10.0 |
0.0 |
3.0 |
-- |
256 (10.7) |
30/14 |
| BUNDABERG AERO |
23.4 |
+0.8 |
14.5 |
+2.9 |
-- |
0.0 |
-- |
-- |
383 (16.0) |
28/08 |
| COOLANGATTA |
21.2 |
+0.1 |
15.8 |
+4.5 |
-- |
26.0 |
-- |
-- |
464 (19.3) |
52/04 |
| BRISBANE AERO |
22.5 |
+1.3 |
15.0 |
+4.5 |
14.7 |
12.2 |
1.2 |
8.8 |
488 (20.3) |
37/13 |
| TOOWOOMBA AIRPORT |
18.6 |
+1.7 |
9.6 |
+2.2 |
-- |
0.4 |
-- |
-- |
328 (13.7) |
28/16 |
| GUNNEDAH RESOURCE CENTRE |
19.5 |
+2.7 |
8.4 |
+2.3 |
5.8 |
0.0 |
2.4 |
-- |
153 ( 6.4) |
-- |
| COFFS HARBOUR MO |
19.7 |
+0.3 |
13.2 |
+4.1 |
11.4 |
27.6 |
0.8 |
-- |
434 (18.1) |
30/03 |
| PORT MACQUARIE AIRPORT AWS |
19.3 |
-0.1 |
11.6 |
+3.5 |
-- |
27.6 |
-- |
-- |
146 ( 6.1) |
21/01 |
| WILLIAMTOWN RAAF |
16.4 |
-1.3 |
8.4 |
+0.5 |
-- |
0.0 |
-- |
-- |
193 ( 8.0) |
21/09 |
| GOSFORD (NARARA RESEARCH STATION) AWS |
19.6 |
+1.7 |
8.3 |
+1.8 |
-- |
0.8 |
-- |
-- |
13 ( 0.5) |
17/14 |
| ORANGE AGRICULTURAL INSTITUTE |
12.3 |
+1.8 |
3.0 |
+0.5 |
-1.0 |
0.1 |
1.9 |
7.9 |
-- |
-- |
| DUBBO AIRPORT AWS |
19.5 |
+3.1 |
5.9 |
+1.4 |
-- |
0.0 |
-- |
-- |
289 (12.0) |
30/00 |
| SYDNEY AIRPORT AMO |
20.5 |
+2.9 |
11.1 |
+2.5 |
8.9 |
0.6 |
2.4 |
6.7 |
240 (10.0) |
26/12 |
| RICHMOND RAAF |
20.5 |
+2.5 |
6.9 |
+2.0 |
-- |
0.0 |
-- |
-- |
11 ( 0.5) |
24/14 |
| BELLAMBI AWS |
19.1 |
+1.4 |
12.7 |
+1.7 |
-- |
0.0 |
-- |
-- |
173 ( 7.2) |
35/14 |
| WAGGA WAGGA AMO |
17.1 |
+3.3 |
7.6 |
+3.9 |
3.4 |
0.6 |
0.8 |
4.0 |
238 ( 9.9) |
50/21 |
| ALBURY AIRPORT AWS |
15.5 |
+1.3 |
5.5 |
+1.7 |
-- |
3.8 |
-- |
-- |
46 ( 1.9) |
35/20 |
| MILDURA AIRPORT |
18.4 |
+2.4 |
2.6 |
-2.6 |
4.0 |
0.0 |
1.8 |
6.2 |
356 (14.8) |
59/15 |
| TATURA INST SUSTAINABLE AG |
15.8 |
+1.8 |
7.9 |
+4.2 |
-1.5 |
0.0 |
1.2 |
-- |
359 (15.0) |
39/11 |
| BENDIGO AIRPORT |
10.8 |
-2.5 |
6.6 |
+3.1 |
-- |
0.0 |
-- |
-- |
392 (16.3) |
37/02 |
| MELBOURNE REGIONAL OFFICE |
14.0 |
-0.1 |
10.7 |
+3.8 |
8.5 |
0.0 |
2.0 |
-- |
-- |
-- |
| BALLARAT AERODROME |
8.8 |
-2.0 |
4.8 |
+0.8 |
-- |
0.0 |
-- |
-- |
810 (33.8) |
�
57/06 |
| LAUNCESTON (TI TREE BEND) |
15.7 |
+2.6 |
5.3 |
+2.4 |
-- |
1.2 |
-- |
-- |
463 (19.3) |
57/14 |
| HOBART AIRPORT |
16.0 |
+3.1 |
1.3 |
-3.3 |
3.8 |
0.0 |
1.0 |
3.9 |
433 (18.0) |
65/16 |
| |
Max
°
C |
+/- norm
°
C |
Min
°
C |
+/- norm
°
C |
Grass Min
°
C |
Rain to 9am mm |
Evaporation to 9am mm |
Sunshine hours |
Wind Run to 9am km |
Maximum Gust km/h / hour of occurrence |
|
| Hottest |
| Highest maximum temperature> | Greatest variation above normal maximum |
Highest minimum temperature | Greatest variation above normal minimum |
33.7 MIDDLE POINT AWS N Rivers NT
33.0 OENPELLI N Rivers NT
32.9 JABIRU AIRPORT N Rivers NT
32.5 BATCHELOR AERO N Rivers NT
32.2 COEN AIRPORT N Peninsula QLD
32.2 SCHERGER RAAF N Peninsula QLD
|
+4.5 : 16.5 HOBART (ELLERSLIE ROAD) Southeast TAS
+4.2 : 15.4 BUSHY PARK (BUSHY PARK ESTATES) Derwent Valley TAS
+4.1 : 20.0 CONDOBOLIN AIRPORT AWS CW Plains S NSW
+4.0 : 21.7 WILCANNIA (REID ST) Far Northwest NSW
+3.8 : 13.7 KATOOMBA (MURRI ST) C Tablelands S NSW
|
25.0 COCOS ISLAND AIRPORT Islands ISL
23.5 COCONUT ISLAND N Peninsula QLD
23.3 WILLIS ISLAND Islands ISL
23.3 CHRISTMAS ISLAND AERO Islands ISL
23.2 CAPE WESSEL Islands ISL
|
+8.0 : 8.0 WOOLBROOK (DANGLEMAH ROAD) NW Slopes S NSW
+7.6 : 11.8 WYNYARD AIRPORT N Coast TAS
+7.5 : 7.5 GLEN INNES AIRPORT AWS N Tablelands W NSW
+7.4 : 10.0 STANTHORPE LESLIE PARADE Darling Downs E QLD
+7.1 : 9.5 TENTERFIELD (FEDERATION PARK) N Tablelands W NSW
+7.1 : 15.0 GYMPIE Brisbane/SE Coast QLD
|
| Coldest |
| Lowest maximum temperature | Greatest variation below normal maximum |
Lowest minimum temperature | Greatest variation below normal minimum |
-0.3 MOUNT HOTHAM Upper NE VIC
0.0 THREDBO AWS Snowy Mtns NSW
0.7 MOUNT BULLER Upper NE VIC
1.0 FALLS CREEK Upper NE VIC
1.9 MOUNT BAW BAW W Gippsland VIC
|
-4.0 : 13.5 MUNGLINUP WEST Goldfields WA
-3.8 : 14.3 NORSEMAN AERO Goldfields WA
-3.7 : 15.4 FORREST Eucla WA
-3.3 : 14.6 SOUTHERN CROSS AIRFIELD Goldfields WA
-2.9 : 16.7 GINGIN AERO Lower West WA
-2.9 : 16.0 EYRE Eucla WA
|
-3.2 BOMBALA (THERRY STREET) Goulburn/Monaro NSW
-2.6 GEEVESTON (CEMETERY ROAD) Southeast TAS
-2.5 GROVE (RESEARCH STATION) Southeast TAS
-2.3 THREDBO AWS Snowy Mtns NSW
**S** -2.3 WATARRKA N Plateau NT
|
**S** -9.2 : -2.3 WATARRKA N Plateau NT
-6.8 : -0.5 WARBURTON AIRFIELD Interior WA
-6.5 : 9.4 KUNUNURRA AERO E Kimberley WA
-6.3 : 3.7 MOUNT ISA AERO Gulf Country QLD
-6.1 : 11.5 WYNDHAM N Kimberley WA
|
|
Sunniest &
dullest |
Windiest |
Highest gusts |
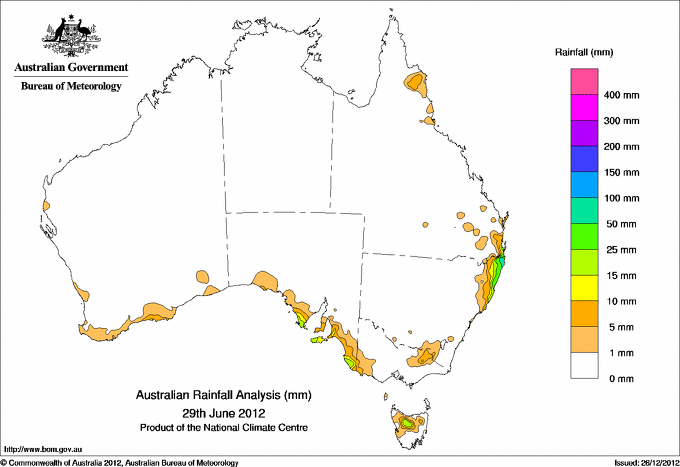
Todays highest rainfall totals for the 24 hours to 9am. It
includes the top 5 totals nationally followed by all reported falls of 50mm or more. |
Highest
and lowest recordings of hours of sunshine for the 24 hours to midnight. |
Highest wind
run totals in kilometres for the 24 hours to 9am (average speed in brackets).
All reported runs >
=25km/h are shown. |
Highest wind
gusts in km/h for the 24 hours to midnight followed by the hour in which it occurred.
All stations with gusts >
89km/h are shown. |
112.0 MACLEAN (SOUTH ARM) North Coast NSW
93.0 NUMINBAH Brisbane/SE Coast QLD
90.2 ROSEBANK (UPPER COOPERS CREEK) North Coast NSW
87.0 MULLUMBIMBY (FAIRVIEW FARM) North Coast NSW
86.4 LOWER SPRINGBROOK ALERT Brisbane/SE Coast QLD
QUEENSLAND
Brisbane/SE Coast
93.0 NUMINBAH
86.4 LOWER SPRINGBROOK ALERT
77.0 TOMEWIN - TALLOWOOD
70.0 SPRINGBROOK ROAD
52.0 O'REILLYS ALERT
50.0 POINT LOOKOUT BOWLS CLUB
NEW SOUTH WALES
North Coast
112.0 MACLEAN (SOUTH ARM)
90.2 ROSEBANK (UPPER COOPERS CREEK)
87.0 MULLUMBIMBY (FAIRVIEW FARM)
85.8 BANGALOW (FOWLERS LANE)
85.0 DOON DOON (MCCABES ROAD)
84.2 ROSEBANK (REPENTANCE CREEK)
82.0 GREEN PIGEON (MORNING VIEW)
82.0 MEERSCHAUMVALE (MEERSCHAUM VALE (BARDEN)
79.0 NASHUA (WILSONS RIVER)
67.0 MEERSCHAUM VALE (JENBETDAPH)
66.0 NIMBIN POST OFFICE
65.0 BRUNSWICK HEADS BOWLING CLUB
62.4 MCLEANS RIDGES (LASCOTT DRIVE)
61.8 BALLINA (BURNET ST)
59.0 EWING BRIDGE CORNDALE (COOPERS CK)
58.0 BOAT HARBOUR (ROUS RIVER)
53.0 NIMBIN (GOOLMANGAR CREEK)
51.6 THE CHANNON
MidNorth Coast N
64.0 PROMISED LAND (BELLINGEN (CRYSTAL CREEK)
60.0 LOWER BUCCA
50.0 NANA GLEN (COWLING CLOSE)
|
11.1 GOVE AIRPORT N Rivers NT
10.9 DARWIN AIRPORT N Rivers NT
10.7 BROOME AIRPORT W Kimberley WA
10.7 RABBIT FLAT N Plateau NT
10.6 TENNANT CREEK AIRPORT N Plateau NT
.....
2.7 EAST SALE AIRPORT W Gippsland VIC
2.4 PERTH AIRPORT Lower West WA
2.3 CANBERRA AIRPORT Goulburn/Monaro NSW
0.9 STRATHGORDON VILLAGE W Coast TAS
0.0 NORFOLK ISLAND AERO Islands ISL
|
1440 (60.0) CAPE MORETON LIGHTHOUSE Brisbane/SE Coast QLD
1370 (57.1) MOUNT WELLINGTON Southeast TAS
1279 (53.3) MOUNT READ W Coast TAS
1258 (52.4) DOUBLE ISLAND POINT LIGHTHOUSE Brisbane/SE Coast QLD
1173 (48.9) CAPE SORELL W Coast TAS
1097 (45.7) LORD HOWE ISLAND AERO Islands ISL
1087 (45.3) NEPTUNE ISLAND W Agricultural SA
1079 (45.0) MOUNT BULLER Upper NE VIC
1006 (41.9) GRAMPIANS (MOUNT WILLIAM) Wimmera S VIC
1005 (41.9) BYRON BAY (CAPE BYRON AWS) North Coast NSW
944 (39.3) CAPE GRIM BAPS (COMPARISON) N Coast TAS
944 (39.3) TASMAN ISLAND Southeast TAS
936 (39.0) GOLD COAST SEAWAY Brisbane/SE Coast QLD
926 (38.6) CAPE GRIM N Coast TAS
921 (38.4) CAPE WILLOUGHBY Yorke Pen/Kanga Is SA
901 (37.5) WALLAN (KILMORE GAP) N Central VIC
898 (37.4) FALLS CREEK Upper NE VIC
860 (35.8) MARIA ISLAND (POINT LESUEUR) E Coast TAS
834 (34.8) MELBOURNE AIRPORT E Central VIC
833 (34.7) COLAC (MOUNT GELLIBRAND) W Coast VIC
819 (34.1) LOW HEAD N Coast TAS
810 (33.8) BALLARAT AERODROME Western Plains VIC
803 (33.5) CAPE BORDA Yorke Pen/Kanga Is SA
784 (32.7) THREDBO AWS Snowy Mtns NSW
762 (31.8) CAPE JAFFA (THE LIMESTONE) Lower SE SA
761 (31.7) PORTLAND NTC AWS W Coast VIC
760 (31.7) LUNCHEON HILL (FORESTRY) N Coast TAS
756 (31.5) EDDYSTONE POINT E Coast TAS
749 (31.2) MINLATON AERO Yorke Pen/Kanga Is SA
749 (31.2) KING ISLAND AIRPORT King Island TAS
748 (31.2) WILLIS ISLAND Islands ISL
735 (30.6) COULTA (COLES POINT) W Agricultural SA
735 (30.6) YAMBA PILOT STATION North Coast NSW
733 (30.5) HOGAN ISLAND Islands ISL
730 (30.4) CAPE OTWAY LIGHTHOUSE W Coast VIC
701 (29.2) MOUNT CRAWFORD (MT CRAWFORD AWS) Adelaide/Lofty SA
675 (28.1) TUNNACK FIRE STATION Southeast TAS
670 (27.9) SUNSHINE COAST AIRPORT Brisbane/SE Coast QLD
667 (27.8) HAMILTON AIRPORT W Coast VIC
663 (27.6) NOARLUNGA Adelaide/Lofty SA
663 (27.6) GREEN CAPE AWS South Coast NSW
660 (27.5) DEVONPORT AIRPORT N Coast TAS
656 (27.3) ROSEWORTHY AWS Adelaide/Lofty SA
645 (26.9) STENHOUSE BAY Yorke Pen/Kanga Is SA
644 (26.8) REDCLIFFE Brisbane/SE Coast QLD
630 (26.3) AIREYS INLET W Coast VIC
626 (26.1) ESSENDON AIRPORT E Central VIC
622 (25.9) SNOWTOWN (RAYVILLE PARK) Lower North SA
618 (25.8) KADINA AWS Yorke Pen/Kanga Is SA
616 (25.7) MORTLAKE RACECOURSE W Coast VIC
616 (25.7) FLINDERS ISLAND AIRPORT Flinders Is/Bass St TAS
614 (25.6) COCOS ISLAND AIRPORT Islands ISL
612 (25.5) GABO ISLAND LIGHTHOUSE E Gippsland VIC
609 (25.4) EDITHBURGH Yorke Pen/Kanga Is SA
607 (25.3) SWAN ISLAND E Coast TAS
|
131/21 THREDBO AWS Snowy Mtns NSW
115/17 MOUNT BULLER Upper NE VIC
104/07 NEPTUNE ISLAND W Agricultural SA
94/16 HOGAN ISLAND Islands ISL
91/13 MOUNT READ W Coast TAS
|
�