Wednesday 14 JUN 2006

Home page

DWS ARCHIVE
2024 2023 2022 2021 2020 2019 2018 2017 2016 2015 2014 2013 2012 2011 2010 2009 2008 2007 2006 2005 2004 2003
Before 2003

About the DWS

2006

Dec

M Tu W Th F Sa Su
        01 02 03
04 05 06 07 08 09 10
11 12 13 14 15 16 17
18 19 20 21 22 23 24
25 26 27 28 29 30 31

Nov

M Tu W Th F Sa Su
    01 02 03 04 05
06 07 08 09 10 11 12
13 14 15 16 17 18 19
20 21 22 23 24 25 26
27 28 29 30      

Oct

M Tu W Th F Sa Su
            01
02 03 04 05 06 07 08
09 10 11 12 13 14 15
16 17 18 19 20 21 22
23 24 25 26 27 28 29
30 31          

Sept

M Tu W Th F Sa Su
        01 02 03
04 05 06 07 08 09 10
11 12 13 14 15 16 17
18 19 20 21 22 23 24
25 26 27 28 29 30  

August

M Tu W Th F Sa Su
  01 02 03 04 05 06
07 08 09 10 11 12 13
14 15 16 17 18 19 20
21 22 23 24 25 26 27
28 29 30 31      

July

M Tu W Th F Sa Su
          01 02
03 04 05 06 07 08 09
10 11 12 13 14 15 16
17 18 19 20 21 22 23
24 25 26 27 28 29 30
31            

June

M Tu W Th F Sa Su
      01 02 03 04
05 06 07 08 09 10 11
12 13 14 15 16 17 18
19 20 21 22 23 24 25
26 27 28 29 30    

May

M Tu W Th F Sa Su
01 02 03 04 05 06 07
08 09 10 11 12 13 14
15 16 17 18 19 20 21
22 23 24 25 26 27 28
29 30 31        

April

M Tu W Th F Sa Su
          01 02
03 04 05 06 07 08 09
10 11 12 13 14 15 16
17 18 19 20 21 22 23
24 25 26 27 28 29 30

March

M Tu W Th F Sa Su
    01 02 03 04 05
06 07 08 09 10 11 12
13 14 15 16 17 18 19
20 21 22 23 24 25 26
27 28 29 30 31    

February

M Tu W Th F Sa Su
    01 02 03 04 05
06 07 08 09 10 11 12
13 14 15 16 17 18 19
20 21 22 23 24 25 26
27 28          

January

M Tu W Th F Sa Su
            01
02 03 04 05 06 07 08
09 10 11 12 13 14 15
16 17 18 19 20 21 22
23 24 25 26 27 28 29
30 31          

Monthly summaries:
from BoM

Find a place:
Google Maps |
Aust Gazetteer|
Geonames

Weather terms:
WeatherZone | BoM |
American Met Soc | NOAA | uk.sci.weather | India Meteorological Department

National Daily Weather Summary

Records set | Charts | Cities | Hottest | Coldest | Rain, sun & wind | Downpours & gales
State extremes | Noteworthy weather | Capital Cities | Regional Cities | Alpine Stations
Charts and data courtesy Bureau of Meteorology. MTSAT-1R operated by JMA
Noteworthy weather today
significant newsworthy major

When reading these descriptions of today's weather events, please refer to the charts and tables for support and details. The descriptions serve to point out significant events and add information that is not available elsewhere on the page.

AUS: Cold snap intensifies across the continent

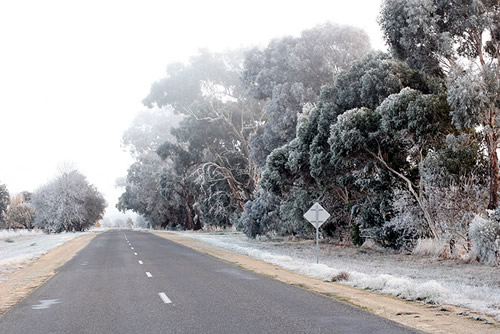
Exquisite needles of hoar frost decorate a barbed-wire fence (top), while frost and hoar frost coat trees to their tops along a roadside near Wangaratta VIC (above).

A normal frost is made up of frozen dew or deposits of white ice crystals which form provided the air is saturated and is at or below zero degrees. Ground frosts are common, even when the air temperature a metre or so above ground level is above freezing point, because in the calm conditions that favour frost formation there is usually a steep temperature drop -- as much as 5 to 7C -- in the metre above the ground. Hoar frosts differ from normal frosts in that they are formed by droplets of supercooled water vapour that freeze on contact with frozen surfaces, such as the barbed wire above or ice crystals already attached to objects. This produces delicate needles, fans and other crystal structures.

In the roadside photo above, the vapour is very evident as a supercooled fog, and sub-zero temperatures and frost extend to the tops of the trees. Frost formed by supercooled droplets of fog coming into contact with frozen objects is often referred to as rime; the main difference is that rime formation assumes that wind is blowing constantly past the objects, leading to a build-up of rough ice crystals on the windward side of the objects. In this case, while fog has enhanced the frost build up, there has been no wind.

Photos: Rob Alexander

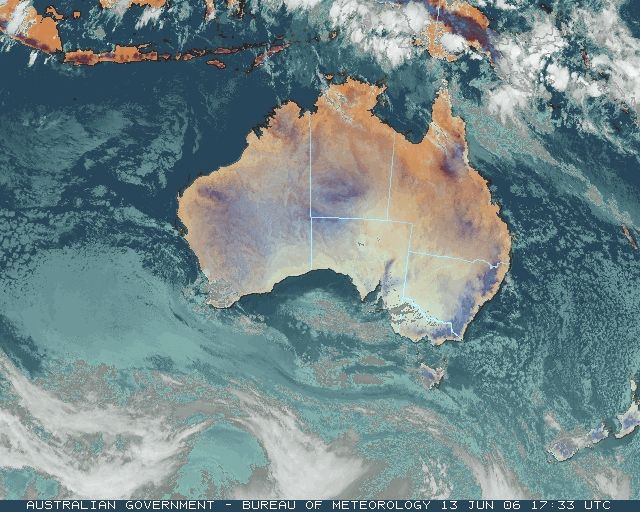
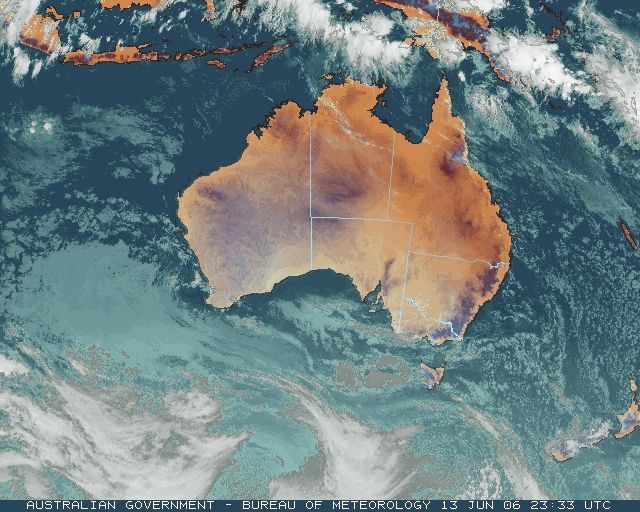
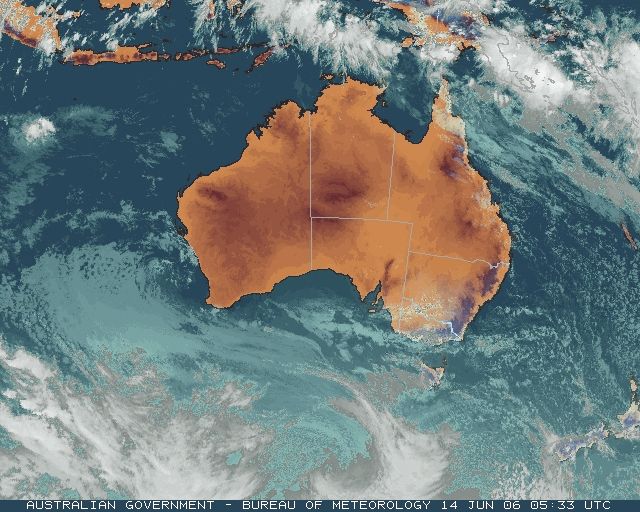
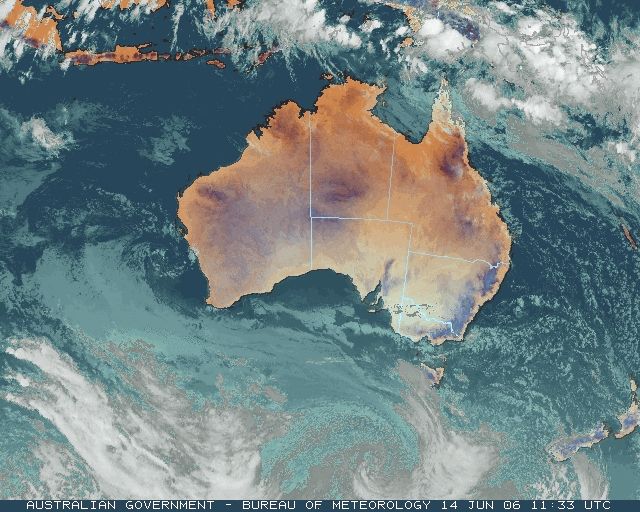
The strong 1035hPa high over SE AUS intensified its frosty grip this morning. The temperature anomaly map below shows that most of the continent other than NE QLD and southern TAS experienced below to well-below normal overnight lows, but the actual minimum temperature map shows the extraordinary spread of sub-zero temperatures.

Particularly cold pockets developed in NE VIC, in NSW from the Riverina to the Central Tablelands, and in far-flung parts of SA and WA. Records toppled in these areas (full list below), some notable ones being:

  • In NE VIC, Benalla (49 year history), Rutherglen (42 years) and Wangaratta (20 years) all registered their coldest temperatures on record for any month. Rutherglen's -7.5 knocked 0.9 off the previous all-time record.
  • Just over the border in NSW, Corowa's -5.0 was also its coldest temperature in 34 years of observations.
  • Minus 3.0 at Parkes was its coldest June reading in half a century
  • In SA, though it was exceptionally cold in the Murray Valley and Central North (Yongala recorded -7.2), records fell at coastal locations. Elliston, on the western coast of the Eyre Peninsula, dropped to -0.8, its first sub-zero June temperature in 45 years, while Kingscote's -2.0 on Kangaroo Island was a new all-time low in 12 years of record. Adelaide's low of 1.3 was the cities coldest temperature since 1989.
  • Six centres in the SE quarter of WA set new records. Eyre, Forrest and Carnegie, all with relatively short histories, set new all-time records, with Eyre's screen minimum air temperature a very low -5.9 and the grass minimum -7.0. Balladonia and Salmon Gums, with 40 and 36 year histories, had their lowest June minimum on record.
  • The cold night extended into the tropics in WA, with Karatha and Paraburdoo reporting their lowest temperatures in over 10 years of operation.
  • Fog continued through all or most of the day in parts of NE VIC and the NSW Southern Tablelands, producing some unusually low maximum temperatures. At Corryong, the mercury only made it to 2.0C, 1.1 below the town's previous coldest day on 9 July 1995 in 33 years of record.

The Goulburn-Murray area of NE VIC is no stranger to winter frost, but 23 of the past 25 mornings have produced sub-zero temperatures at Wangaratta. This morning's low of -7.2 followed minima of -5.6 yesterday and -6.6 the morning before, producing unaccustomed domestic experiences for the area's inhabitants. Household water pipes have frozen and in some cases burst, one resident telling ABC Rural "most people would not think that brass taps would explode with the frost. We've had five brass taps fittings on taps break apart because they can't handle the stress of the frost." Irrigation channels, ponds and dams have frozen with a cap of ice too thick to be penetrated by thrown rocks. One dog owner, whose dog has a regular dip in a water trough on her daily run said "she jumps in every morning no matter how cold it is. A couple of mornings this week she's broken the ice as she's jumped in. This morning she's skated across, hit the lip on the other end and cart wheeled down the paddock. It was so frozen that even a dog jumping in couldn't break the ice." Drivers passing through supercooled fog have reported rime ice buildup on antennas and external mirrors up to 1.5cm thick. Black ice and ice build-up on vehicles due to fog have caused numerous minor accidents in NE VIC, Central Western NSW and around Canberra, with the Great Western Highway between Blackheath and Bathurst and local roads around Lithgow badly hit.

In far northern WA, the unusually cold conditions are feared to have killed 660,000 prawn fingerlings at one aquaculture company. Water temperature has dropped to 14.5C, and marine prawns stop feeding at 20C and die at 13C.

QLD: Strong trade winds on QLD coast. The 1035hPa high has also produced a strong pressure gradient along the QLD coast, the tightly crowded isobars on the surface charts below indicating strong onshore southeasterly trade winds. Weipa recorded its highest wind gust for June in 23 years today (70km/h) while its 24-hour average speed of 25.4km/h to 9am Thursday was also a record. Lockhart River's gust of 67km/h was its strongest for June in 26 years. Cape Flattery in the far north and Double Island Point in the south both reported gusts of 85km/h, while 25 to 50mm of rain was recorded on the Tropical North Coast.

TAS: Strong westerlies in the south. On the other side of the high, strong westerlies have been blowing across southern TAS. Maatsuyker Island, off the South Coast, reported 24-hour average wind speeds of 71.9km/h to 9 this morning and 81.2 to 9am Thursday with gusts to 117km/h late this evening.


Records set or equalled today

These records are based on data received as at 1830 EST on 12/01/2007. Help in interpreting these statistics and information on quality control is here.

District Site Today Previous monthly record Previous all time record
if equalled or broken
Comments
Reading Reading Date Years Reading Date Years
Lowest grass minimum temperature

WA

Eucla

011019

EYRE

-7.0

-5.7

21/06/2004

16

-7.0

06/07/2004

22

VIC

Lower NE

082002

BENALLA (SHADFORTH STREET)

-7.5

-7.3

23/06/1985

39

VIC

Upper NE

083083

EDI UPPER

-4.8

-4.8

18/06/1998

19

Equal to record.

Lowest minimum temperature

WA

E Pilbara

004083

KARRATHA AERO

7.3

8.3

13/06/2006

12

7.8

15/07/2002

14

Previous record set earlier this month.

WA

E Gascoyne

007185

PARABURDOO AERO

2.4

2.7

28/06/1997

11

2.7

28/06/1997

12

WA

Eucla

011017

BALLADONIA

-2.2

-1.8

29/06/1997

40

WA

Eucla

011019

EYRE

-5.9

-4.9

21/06/2004

18

-5.1

07/08/2002

25

WA

Eucla

011045

BALGAIR

-1.7

-0.5

04/06/1994

24

WA

Eucla

011052

FORREST

-2.7

-1.5

13/06/2000

12

-2.0

21/07/1997

14

WA

Goldfields

012071

SALMON GUMS RES.STN.

-4.8

-2.6

23/06/1974

36

WA

Interior

013015

CARNEGIE

-3.6

-1.5

15/06/2005

17

-1.5

15/06/2005

19

SA

W Agricultural

018069

ELLISTON

-0.8

0.0

29/06/2002

45

SA

Lower North

021131

CLARE HIGH SCHOOL

-3.9

-2.8

13/06/2006

12

-3.7

01/07/2002

14

Previous record set earlier this month.

SA

Yorke Peninsula

022046

EDITHBURGH

0.8

1.6

13/06/2006

12

Previous record set earlier this month.

SA

Kangaroo Is

022841

KINGSCOTE AERO

-2.0

-1.4

18/06/1998

12

-1.9

25/08/2002

14

NSW

C Tablelands S

063303

ORANGE AIRPORT AWS

-6.8

-6.1

01/06/2005

11

NSW

CW Slopes S

065026

PARKES (MACARTHUR STREET)

-3.0

-2.6

19/06/1998

50

NSW

SW Slopes N

073141

GUNDAGAI (WILLIAM ST)

-4.6

-4.1

19/06/1998

12

NSW

Riverina E

074034

COROWA AIRPORT

-5.0

-4.5

18/06/1998

33

-4.5

18/06/1998

36

VIC

Lower North

080023

KERANG

-3.4

-3.4

09/06/1982

43

Equal to record.

VIC

Upper North

081124

YARRAWONGA

-5.3

-4.8

13/06/2006

14

Previous record set earlier this month.

VIC

Lower NE

082002

BENALLA (SHADFORTH STREET)

-4.5

-4.4

26/06/1965

49

-4.4

26/06/1965

51

VIC

Lower NE

082039

RUTHERGLEN RESEARCH

-7.5

-6.5

22/06/1984

42

-6.6

15/07/1984

43

VIC

Lower NE

082138

WANGARATTA AERO

-7.2

-6.6

12/06/2006

20

-6.6

12/06/2006

21

Previous record set earlier this month.

VIC

Upper NE

083083

EDI UPPER

-1.8

-1.8

23/06/1995

19

Equal to record.

VIC

N Central

088051

REDESDALE

-3.8

-3.4

23/06/1995

12

Lowest maximum temperature

VIC

Lower NE

082011

CORRYONG (PARISH LANE)

2.0

3.8

22/06/1984

33

3.1

09/07/1995

35

Highest wind gust (km/h)

QLD

N Peninsula

027045

WEIPA AERO

71

68.0

02/06/1987

24

QLD

S Peninsula

028008

LOCKHART RIVER AIRPORT

67

65.0

22/06/2001

27


The day in charts
Surface charts Satellite images Rain & temperatures
4am EST Rainfall -- 24 hours to 9am
Available about 6am EST Available about 4am EST Available about 2pm EST
Week to 9am | SE AUS detail
10am EST Minimum temperature +/- normal
Available about noon EST Available about 10am EST Available about 2pm EST next day
Actual temperatures
4pm EST Maximum temperature +/- normal
Available about 6pm EST Available about 4pm EST Available about 2pm EST next day
Actual temperatures
10pm EST Solar Radiation
Available about midnight EST Available about 10pm EST Available about 2am EST next day

Summary of observations

For notes on how to interpret the data and quality control issues, see Daily Weather Summary Help.
**S** and **W** precede data flagged by the Bureau as suspicious or wrong
Data is as received at 22:50EST, 14/05/2012.

Major centres
Max
° C
+/- norm
° C
Min
° C
+/- norm
° C
Grass Min
° C
Rain to 9am mm Evaporation to 9am mm Sunshine hours Wind Run to 9am km (24-hour average km/h) Maximum Gust km/h / hour of occurrence
GERALDTON AIRPORT 21.9 +1.0 10.7 -0.3 9.8 0.0 4.0 -- 414 (17.3) 35/08
PERTH AIRPORT 22.9 +4.0 11.9 +2.9 8.3 0.0 3.2 7.7 383 (16.0) 35/13
ALBANY AIRPORT 19.3 +2.7 4.4 -3.7 2.4 0.0 1.2 9.1 139 ( 5.8) 35/10
BUNBURY 22.9 +4.5 7.6 -0.5 -- 0.0 -- -- 187 ( 7.8) 31/12
MANDURAH 22.8 -- 13.4 -- -- 0.0 -- -- 283 (11.8) 28/15
DARWIN AIRPORT 29.5 -1.1 17.4 -2.5 16.9 0.0 7.4 10.0 349 (14.5) 41/13
ALICE SPRINGS AIRPORT 18.7 -1.1 -0.2 -5.3 -5.1 0.0 4.0 10.4 330 (13.8) 37/16
WHYALLA AERO 14.1 -3.2 -1.9 -8.0 -- 0.0 0.6 -- 156 ( 6.5) 17/13
ADELAIDE (KENT TOWN) 15.9 -0.2 1.3 -6.8 -3.3 0.0 1.0 9.6 83 ( 3.5) 17/10
MOUNT GAMBIER AERO 13.3 -0.5 6.6 +0.8 6.2 0.0 1.2 8.5 451 (18.8) 39/10
MOUNT ISA AERO 24.9 0.0 10.9 +0.9 6.6 0.0 4.4 10.3 368 (15.3) 43/12
CAIRNS AERO 25.9 -0.1 19.8 +2.0 19.0 1.4 3.6 3.3 649 (27.0) 65/14
TOWNSVILLE AERO 26.0 +0.4 16.5 +1.9 13.2 0.0 3.2 7.7 418 (17.4) 46/18
MACKAY M.O 21.1 -0.8 16.1 +2.1 -- 1.2 -- 8.5 679 (28.3) 54/09
ROCKHAMPTON AERO 24.3 +0.8 14.0 +3.1 10.6 0.0 5.2 -- 384 (16.0) 46/14
BUNDABERG AERO 22.4 -0.2 13.1 +1.5 -- 0.0 1.6 -- 473 (19.7) 48/14
NAMBOUR DPI 21.2 -0.4 12.3 +3.0 -- 0.6 0.0 -- -- --
COOLANGATTA 21.9 +0.8 12.6 +1.1 -- 0.0 -- -- 360 (15.0) 34/16
BRISBANE AERO 21.9 +0.6 10.3 -0.2 8.7 0.0 2.6 9.4 375 (15.6) 30/10
TOOWOOMBA AIRPORT 17.9 +0.9 7.3 -0.2 -- 0.0 -- -- 486 (20.3) 46/10
GUNNEDAH (DIPNR) 18.1 +1.3 3.0 -3.1 -1.0 0.0 1.8 -- 78 ( 3.3) --
COFFS HARBOUR MO 19.4 0.0 8.1 -1.0 4.2 4.6 2.0 9.2 137 ( 5.7) --
PORT MACQUARIE AIRPORT AWS 20.2 +0.7 7.7 -0.3 -- 0.0 -- -- -- --
WILLIAMTOWN RAAF 18.2 +0.6 3.7 -4.2 1.6 0.2 1.2 9.7 215 ( 9.0) 28/09
GOSFORD (NARARA RESEARCH STATION) AWS 18.0 +0.1 2.1 -4.4 -0.2 0.2 -- -- 41 ( 1.7) 15/10
ORANGE AGRICULTURAL INSTITUTE 14.8 +4.3 1.4 -1.2 -8.0 0.0 1.8 9.0 -- --
DUBBO AIRPORT AWS 16.0 -0.4 -1.8 -6.4 -- 0.0 -- -- -- --
SYDNEY AIRPORT AMO 17.6 0.0 6.2 -2.3 3.3 0.0 1.6 9.5 258 (10.8) 22/14
RICHMOND RAAF 16.7 -1.3 -0.6 -5.5 -- 0.0 -- -- 70 ( 2.9) 17/18
BELLAMBI AWS 15.9 -1.8 7.5 -3.5 -- 0.0 -- -- 173 ( 7.2) 26/06
CANBERRA AIRPORT 10.3 -1.9 -5.1 -6.1 -7.6 0.0 1.0 7.4 178 ( 7.4) 15/13
WAGGA WAGGA AMO 8.7 -5.1 -3.6 -7.3 -4.2 0.2 0.8 3.8 107 ( 4.5) 15/15
ALBURY AIRPORT AWS 10.4 -3.8 -3.0 -6.9 -- 0.2 -- -- 55 ( 2.3) 48/10
MILDURA AIRPORT 14.4 -1.6 -3.0 -8.2 -6.9 0.0 2.0 8.6 72 ( 3.0) 15/13
TATURA INST SUSTAINABLE AG 13.2 -0.8 -5.4 -9.1 -- 0.0 1.2 -- 134 ( 5.6) 18/15
BENDIGO AIRPORT 12.9 -0.3 -4.8 -8.4 -- 0.0 -- -- 106 ( 4.4) 21/11
MELBOURNE REGIONAL OFFICE 15.3 +1.3 5.6 -1.3 2.7 0.0 1.2 -- 111 ( 4.6) 13/09
GEELONG AIRPORT 15.0 +0.4 6.1 -0.2 -- 0.0 -- -- 437 (18.2) 43/12
BALLARAT AERODROME 12.9 +2.1 -0.5 -4.5 -- 0.0 -- -- 182 ( 7.6) 24/13
LAUNCESTON (TI TREE BEND) 15.3 +2.2 -1.8 -4.7 -- 0.2 -- -- 127 ( 5.3) 31/13
HOBART AIRPORT 16.6 +3.7 7.5 +2.9 4.4 0.0 2.0 3.9 489 (20.4) 45/20
Max
° C
+/- norm
° C
Min
° C
+/- norm
° C
Grass Min
° C
Rain to 9am mm Evaporation to 9am mm Sunshine hours Wind Run to 9am km Maximum Gust km/h / hour of occurrence
Hottest
Highest maximum temperature>Greatest variation above normal maximum Highest minimum temperatureGreatest variation above normal minimum

32.4 JABIRU AIRPORT N Rivers NT
31.0 NORTHERN ENDEAVOUR Islands ISL
31.0 OENPELLI N Rivers NT
30.7 MIDDLE POINT AWS N Rivers NT
30.7 WEIPA AERO N Peninsula QLD

+5.2 : 15.1 KATOOMBA (MURRI ST) C Tablelands S NSW
+5.1 : 21.0 DWELLINGUP Lower West WA
+4.9 : 21.4 LAKE GRACE COMPARISON Cent Wheatbelt WA
+4.6 : 22.5 NORTHAM Cent Wheatbelt WA
+4.5 : 23.8 SWANBOURNE Lower West WA
+4.5 : 22.9 BUNBURY Lower West WA
+4.5 : 25.2 ENEABBA Central West WA

25.0 NORTHERN ENDEAVOUR Islands ISL
24.7 COCOS ISLAND AIRPORT Islands ISL
24.4 COCONUT ISLAND N Peninsula QLD
24.1 HORN ISLAND N Peninsula QLD
23.9 CHRISTMAS ISLAND AERO Islands ISL

+6.5 : 8.7 GEEVESTON (CEMETERY ROAD) Southeast TAS
+5.5 : 12.6 SPRINGSURE DAME ST Central Highlands QLD
+4.6 : 8.4 DOVER Southeast TAS
+4.6 : 6.8 MELTON MOWBRAY (NORTH STOCKMAN) Southeast TAS
+4.2 : 9.4 HOBART (ELLERSLIE ROAD) Southeast TAS
+4.2 : 19.1 CARDWELL MARINE PDE N Coast--Herbert QLD

Coldest
Lowest maximum temperatureGreatest variation below normal maximum Lowest minimum temperatureGreatest variation below normal minimum

0.5 MT BAW BAW W Gippsland VIC
1.5 THREDBO AWS Snowy Mtns NSW
2.0 CORRYONG (PARISH LANE) Lower NE VIC
2.9 MOUNT BULLER Upper NE VIC
3.3 MT HOTHAM Upper NE VIC

-9.9 : 2.0 CORRYONG (PARISH LANE) Lower NE VIC
-6.9 : 5.5 KHANCOBAN AWS SW Slopes S NSW
-5.1 : 8.7 WAGGA WAGGA AMO SW Slopes S NSW
-4.5 : 7.5 COOMA VISITORS CENTRE Goulburn/Monaro NSW
-4.3 : 11.0 YANCO AGRICULTURAL INSTITUTE Riverina E NSW
-4.3 : 9.5 GUNDAGAI (WILLIAM ST) SW Slopes N NSW

-9.3 THREDBO VILLAGE Snowy Mtns NSW
-7.5 RUTHERGLEN RESEARCH Lower NE VIC
-7.3 TUMBARUMBA POST OFFICE SW Slopes S NSW
-7.2 BRAIDWOOD RACECOURSE AWS South Coast NSW
-7.2 COOMA AIRPORT AWS Goulburn/Monaro NSW
-7.2 WANGARATTA AERO Lower NE VIC
-7.2 YONGALA Upper North SA

-12.8 : -5.9 EYRE Eucla WA
-11.0 : -7.0 YUNTA AIRSTRIP Northeast SA
-10.5 : -4.8 SALMON GUMS RES.STN. Goldfields WA
-10.5 : -3.6 CARNEGIE Interior WA
-10.3 : -7.2 WANGARATTA AERO Lower NE VIC

Wettest
Sunniest & dullest
Windiest
Highest gusts
Todays highest rainfall totals for the 24 hours to 9am. It includes the top 5 totals nationally followed by all reported falls of 50mm or more.
Highest and lowest recordings of hours of sunshine for the 24 hours to midnight.
Highest wind run totals in kilometres for the 24 hours to 9am (average speed in brackets). All reported runs > =25km/h are shown.
Highest wind gusts in km/h for the 24 hours to midnight followed by the hour in which it occurred. All stations with gusts > 89km/h are shown.
95.3 ROCKY POINT SUGAR MILL Brisbane/SE Coast QLD
74.0 TREE HOUSE CREEK N Coast--Barron QLD
61.0 GRAHAM RANGE N Coast--Barron QLD
59.0 TULLY SUGAR MILL N Coast--Herbert QLD
43.0 BABINDA POST OFFICE N Coast--Barron QLD

QUEENSLAND
N Coast--Barron
74.0 TREE HOUSE CREEK
61.0 GRAHAM RANGE
43.0 BABINDA POST OFFICE
N Coast--Herbert
59.0 TULLY SUGAR MILL
Brisbane/SE Coast
95.3 ROCKY POINT SUGAR MILL

10.6 RABBIT FLAT N Plateau NT
10.5 BROOME AIRPORT W Kimberley WA
10.5 GILES METEOROLOGICAL OFFICE Interior WA
10.4 TENNANT CREEK AIRPORT N Plateau NT
10.4 ALICE SPRINGS AIRPORT N Plateau NT

.....

2.5 MELBOURNE AIRPORT E Central VIC
1.8 BUNDOORA (LATROBE UNIVERSITY) E Central VIC
1.4 LAKE LEAKE (ELIZABETH RIVER) E Coast TAS
0.8 KAIRI RESEARCH STATION N Coast--Barron QLD
0.0 STRATHGORDON VILLAGE W Coast TAS

1725 (71.9) MAATSUYKER ISLAND LIGHTHOUSE Southeast TAS
1452 (60.5) MOUNT WELLINGTON Southeast TAS
1116 (46.5) HOGAN ISLAND Islands ISL
1046 (43.6) DOUBLE ISLAND POINT LIGHTHOUSE Brisbane/SE Coast QLD
1018 (42.4) RUNDLE ISLAND Wide Bay/Burnett QLD
985 (41.0) CAPE FLATTERY N Coast--Barron QLD
916 (38.2) HAMILTON ISLAND AIRPORT Central Coast E QLD
891 (37.1) LOW HEAD N Coast TAS
881 (36.7) CAPE MORETON LIGHTHOUSE Brisbane/SE Coast QLD
867 (36.1) HARTZ MOUNTAIN (KEOGHS PIMPLE) Southeast TAS
834 (34.8) SWAN ISLAND E Coast TAS
819 (34.1) CAPE GRIM BAPS N Coast TAS
802 (33.4) WILSONS PROMONTORY LIGHTHOUSE W Gippsland VIC
780 (32.5) FLINDERS ISLAND AIRPORT Flinders Is/Bass St TAS
765 (31.9) MOUNT READ W Coast TAS
750 (31.3) ROLLESTON METEOR ST Central Highlands QLD
744 (31.0) COCONUT ISLAND N Peninsula QLD
720 (30.0) COCOS ISLAND AIRPORT Islands ISL
715 (29.8) CAPE LEEUWIN Lower West WA
709 (29.5) THREDBO AWS Snowy Mtns NSW
679 (28.3) MACKAY M.O Central Coast E QLD
669 (27.9) MCCLUER ISLAND N Rivers NT
649 (27.0) CAIRNS AERO N Coast--Barron QLD
633 (26.4) CAPE BRUNY (CAPE BRUNY) Southeast TAS
608 (25.3) LUCINDA POINT N Coast--Herbert QLD
117/23 MAATSUYKER ISLAND LIGHTHOUSE Southeast TAS
111/22 MOUNT WELLINGTON Southeast TAS
85/22 CAPE FLATTERY N Coast--Barron QLD
85/03 DOUBLE ISLAND POINT LIGHTHOUSE Brisbane/SE Coast QLD
80/07 HARTZ MOUNTAIN (KEOGHS PIMPLE) Southeast TAS
80/00 MOUNT READ W Coast TAS

Downpours High AWS wind reports
High rainfall for periods of 6 hours or less from AWS and synoptic reports. Storm force gusts (>89km/h) and 10-minute mean gales (>62km/h) reported by AWSs. Wind direction and mean windspeed are shown in brackets.
WESTERN AUSTRALIA
Lower West
NORTH WALPOLE
6.8mm in 31 min to 17:00 13.2mm/h
QUEENSLAND
N Peninsula
COCONUT ISLAND
7.6mm in 10 min to 12:01 45.6mm/h
Central Coast E
SAMUEL HILL AERO
14.0mm in 1 hr to 22:00 14.0mm/h

QUEENSLAND
N Coast--Barron
GREEN ISLAND : 80(150/ 65 ) at 16:30
Brisbane/SE Coast
DOUBLE ISLAND POINT LIGHTHOUSE : 85(140/ 74 ) at 03:55
TASMANIA
Southeast
MAATSUYKER ISLAND LIGHTHOUSE : 98(330/ 83 ) at 22:00
MOUNT WELLINGTON : 109(250/ 80 ) at 07:00