|
For notes on how to interpret
the data and quality control issues, see Daily Weather Summary Help.
**S** and **W** precede data flagged by the Bureau as suspicious or wrong
Data is as received at 03:45EST, 15/05/2012.
|
|
| |
Max
°
C |
+/- norm
°
C |
Min
°
C |
+/- norm
°
C |
Grass Min
°
C |
Rain to 9am mm |
Evaporation to 9am mm |
Sunshine hours |
Wind Run to 9am km (24-hour average km/h) |
Maximum Gust km/h / hour of occurrence |
| GERALDTON AIRPORT |
29.3 |
-2.3 |
16.5 |
-1.8 |
14.9 |
0.0 |
11.2 |
-- |
820 (34.2) |
-- |
| PERTH AIRPORT |
27.3 |
-4.3 |
15.4 |
-1.5 |
14.7 |
0.0 |
10.0 |
13.0 |
512 (21.3) |
43/14 |
| ALBANY AIRPORT |
26.2 |
+1.5 |
15.1 |
+1.4 |
13.3 |
0.0 |
7.6 |
12.2 |
394 (16.4) |
54/10 |
| BUNBURY |
24.6 |
-4.8 |
11.8 |
-3.3 |
-- |
0.0 |
-- |
-- |
273 (11.4) |
43/14 |
| MANDURAH |
24.7 |
-- |
17.2 |
-- |
-- |
0.0 |
-- |
-- |
491 (20.5) |
44/16 |
| DARWIN AIRPORT |
32.5 |
+0.7 |
25.0 |
+0.2 |
25.9 |
14.4 |
7.4 |
6.8 |
252 (10.5) |
24/21 |
| ALICE SPRINGS AIRPORT |
37.0 |
+0.6 |
22.5 |
+1.1 |
21.3 |
0.0 |
5.2 |
12.3 |
323 (13.5) |
39/12 |
| WHYALLA AERO |
26.7 |
-3.2 |
18.8 |
+1.4 |
-- |
0.0 |
-- |
-- |
559 (23.3) |
44/16 |
| ADELAIDE (KENT TOWN) |
29.0 |
-0.1 |
17.4 |
+0.4 |
-- |
0.0 |
9.2 |
11.8 |
254 (10.6) |
30/15 |
| MOUNT GAMBIER AERO |
25.7 |
+0.5 |
9.0 |
-2.1 |
5.8 |
0.0 |
7.0 |
10.8 |
352 (14.7) |
43/14 |
| MOUNT ISA AERO |
30.0 |
-6.3 |
23.8 |
0.0 |
23.2 |
22.4 |
5.4 |
2.6 |
281 (11.7) |
37/14 |
| CAIRNS AERO |
32.3 |
+0.9 |
23.1 |
-0.6 |
21.7 |
62.0 |
2.4 |
11.8 |
311 (13.0) |
31/13 |
| TOWNSVILLE AERO |
31.4 |
+0.1 |
24.5 |
+0.3 |
22.6 |
0.4 |
8.4 |
11.6 |
397 (16.5) |
39/11 |
| MACKAY M.O |
30.2 |
+0.1 |
24.0 |
+0.5 |
-- |
7.4 |
-- |
11.0 |
355 (14.8) |
31/03 |
| ROCKHAMPTON AERO |
32.4 |
+0.5 |
23.4 |
+1.3 |
23.0 |
2.0 |
7.4 |
-- |
308 (12.8) |
34/14 |
| BUNDABERG AERO |
30.7 |
+0.6 |
22.3 |
+0.9 |
-- |
10.4 |
4.2 |
-- |
347 (14.5) |
34/12 |
| NAMBOUR DPI |
29.0 |
-0.3 |
20.0 |
+0.6 |
-- |
0.2 |
-- |
-- |
-- |
-- |
| COOLANGATTA |
30.4 |
+2.3 |
22.0 |
+1.0 |
-- |
0.0 |
-- |
-- |
298 (12.4) |
41/13 |
| BRISBANE AERO |
30.2 |
+1.2 |
21.5 |
+0.4 |
18.9 |
0.0 |
8.2 |
11.7 |
302 (12.6) |
41/12 |
| TOOWOOMBA AIRPORT |
31.6 |
+3.5 |
17.2 |
-0.3 |
-- |
0.0 |
-- |
-- |
453 (18.9) |
46/18 |
| GUNNEDAH RESOURCE CENTRE |
31.5 |
-0.4 |
24.2 |
+5.4 |
19.8 |
0.0 |
9.2 |
-- |
253 (10.5) |
-- |
| COFFS HARBOUR MO |
30.8 |
+3.9 |
22.2 |
+2.8 |
19.8 |
0.0 |
6.8 |
3.6 |
575 (24.0) |
48/14 |
| PORT MACQUARIE AIRPORT AWS |
31.8 |
+4.4 |
20.4 |
+2.3 |
-- |
0.0 |
-- |
-- |
-- |
-- |
| WILLIAMTOWN RAAF |
38.8 |
+10.9 |
20.5 |
+2.5 |
18.7 |
0.0 |
10.8 |
7.2 |
354 (14.8) |
50/16 |
| GOSFORD (NARARA RESEARCH STATION) AWS |
37.7 |
+10.2 |
21.0 |
+4.3 |
20.4 |
0.0 |
-- |
-- |
111 ( 4.6) |
37/18 |
| ORANGE AGRICULTURAL INSTITUTE |
29.1 |
+2.6 |
15.6 |
+2.4 |
11.8 |
28.1 |
10.5 |
6.4 |
-- |
-- |
| DUBBO AIRPORT AWS |
35.1 |
+2.0 |
21.1 |
+3.0 |
-- |
0.2 |
-- |
-- |
412 (17.2) |
57/16 |
| SYDNEY AIRPORT AMO |
33.7 |
+7.3 |
20.9 |
+2.2 |
18.8 |
3.0 |
12.8 |
7.4 |
680 (28.3) |
59/23 |
| RICHMOND RAAF |
38.9 |
+9.1 |
21.6 |
+4.2 |
-- |
0.0 |
-- |
-- |
216 ( 9.0) |
46/16 |
| BELLAMBI AWS |
27.7 |
+2.9 |
20.7 |
+1.8 |
-- |
0.0 |
-- |
-- |
431 (18.0) |
59/22 |
| CANBERRA AIRPORT |
34.1 |
+6.1 |
16.7 |
+3.5 |
15.9 |
21.2 |
11.0 |
12.1 |
295 (12.3) |
44/22 |
| WAGGA WAGGA AMO |
37.9 |
+6.3 |
16.4 |
+0.2 |
13.1 |
15.8 |
15.6 |
12.3 |
442 (18.4) |
65/20 |
| ALBURY AIRPORT AWS |
38.1 |
+5.9 |
19.3 |
+2.7 |
-- |
0.8 |
-- |
-- |
291 (12.1) |
61/22 |
| MILDURA AIRPORT |
36.7 |
+4.5 |
19.2 |
+2.6 |
18.2 |
0.0 |
18.2 |
12.7 |
359 (15.0) |
54/20 |
| TATURA INST SUSTAINABLE AG |
37.0 |
+7.5 |
16.1 |
+2.0 |
-- |
0.0 |
12.6 |
-- |
391 (16.3) |
43/15 |
| BENDIGO AIRPORT |
35.9 |
+6.4 |
14.2 |
+0.3 |
-- |
0.0 |
-- |
-- |
379 (15.8) |
�
48/16 |
| MELBOURNE REGIONAL OFFICE |
28.8 |
+2.9 |
17.2 |
+2.9 |
14.2 |
0.0 |
10.2 |
-- |
159 ( 6.6) |
18/23 |
| GEELONG AIRPORT |
26.6 |
+2.0 |
12.1 |
-1.0 |
-- |
0.0 |
-- |
-- |
370 (15.4) |
41/15 |
| BALLARAT AERODROME |
32.1 |
+7.1 |
10.1 |
-0.7 |
-- |
0.0 |
-- |
-- |
465 (19.4) |
43/18 |
| LAUNCESTON (TI TREE BEND) |
23.5 |
-0.7 |
12.8 |
+0.7 |
-- |
0.0 |
-- |
-- |
305 (12.7) |
46/18 |
| HOBART AIRPORT |
24.2 |
+1.7 |
14.1 |
+2.1 |
10.9 |
0.0 |
3.3 |
12.0 |
369 (15.4) |
46/12 |
| |
Max
°
C |
+/- norm
°
C |
Min
°
C |
+/- norm
°
C |
Grass Min
°
C |
Rain to 9am mm |
Evaporation to 9am mm |
Sunshine hours |
Wind Run to 9am km |
Maximum Gust km/h / hour of occurrence |
|
| Hottest |
| Highest maximum temperature> | Greatest variation above normal maximum |
Highest minimum temperature | Greatest variation above normal minimum |
44.8 GASCOYNE JUNCTION W Gascoyne WA
44.0 MURCHISON W Gascoyne WA
43.3 EMU CREEK STATION W Gascoyne WA
42.4 PARABURDOO AERO E Gascoyne WA
41.2 NEWMAN AERO E Gascoyne WA
|
**S** +11.9 : 28.5 MT HOTHAM Upper NE VIC
+11.1 : 39.4 PARRAMATTA NORTH (MASONS DRIVE) Sydney--east NSW
+10.9 : 38.8 WILLIAMTOWN RAAF Hunter Valley NSW
+10.2 : 37.7 GOSFORD (NARARA RESEARCH STATION) AWS Hunter Valley NSW
+10.1 : 36.8 MANGROVE MOUNTAIN AWS Hunter Valley NSW
+10.1 : 37.1 PEATS RIDGE (WARATAH ROAD) Hunter Valley NSW
|
30.0 NORTHERN ENDEAVOUR Islands ISL
29.3 EMU CREEK STATION W Gascoyne WA
28.6 NGAYAWILI N Rivers NT
28.1 MCCLUER ISLAND N Rivers NT
28.0 TROUGHTON ISLAND N Kimberley WA
|
+8.8 : 27.0 HILLSTON AIRPORT Riverina W NSW
+8.8 : 27.0 IVANHOE POST OFFICE Southwest Plains NSW
+8.6 : 22.0 BEECHWORTH WOOLSHED Lower NE VIC
+8.1 : 21.9 RUTHERGLEN RESEARCH Lower NE VIC
+7.3 : 25.8 MENINDEE POST OFFICE Lower Darling NSW
|
| Coldest |
| Lowest maximum temperature | Greatest variation below normal maximum |
Lowest minimum temperature | Greatest variation below normal minimum |
14.3 MOUNT READ W Coast TAS
15.7 MOUNT WELLINGTON Southeast TAS
18.2 TASMAN ISLAND Southeast TAS
18.3 MAATSUYKER ISLAND LIGHTHOUSE Southeast TAS
18.4 CAPE BRUNY LIGHTHOUSE Southeast TAS
|
-11.3 : 26.4 TIBOOBURRA AIRPORT Far Northwest NSW
-9.8 : 26.3 TIBOOBURRA POST OFFICE Far Northwest NSW
-9.6 : 27.6 BOURKE AIRPORT AWS Upper Darling NSW
-8.5 : 30.4 BEDOURIE POLICE STATION Channel Country QLD
-8.5 : 27.5 CUNNAMULLA POST OFFICE Warrego QLD
|
3.3 EYRE Eucla WA
3.6 LIAWENEE Central Plateau TAS
3.9 MOUNT WELLINGTON Southeast TAS
3.9 MOUNT READ W Coast TAS
**S** 5.0 TIDBINBILLA NATURE RESERVE Goulburn/Monaro NSW
|
-12.0 : 3.3 EYRE Eucla WA
**S** -7.1 : 5.0 TIDBINBILLA NATURE RESERVE Goulburn/Monaro NSW
-6.0 : 10.5 EUCLA Eucla WA
-5.5 : 9.4 COULTA (COLES POINT) W Agricultural SA
|
|
Sunniest &
dullest |
Windiest |
Highest gusts |
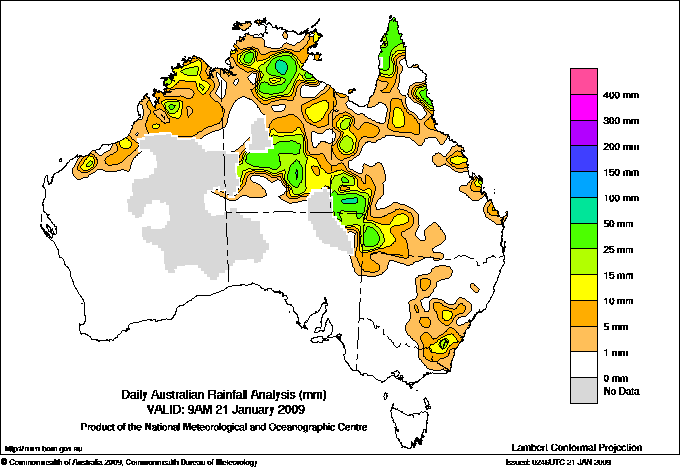
Todays highest rainfall totals for the 24 hours to 9am. It
includes the top 5 totals nationally followed by all reported falls of 50mm or more. |
Highest
and lowest recordings of hours of sunshine for the 24 hours to midnight. |
Highest wind
run totals in kilometres for the 24 hours to 9am (average speed in brackets).
All reported runs >
=25km/h are shown. |
Highest wind
gusts in km/h for the 24 hours to midnight followed by the hour in which it occurred.
All stations with gusts >
89km/h are shown. |
86.0 CARODA (ROSEBERRY PARK) NW Slopes N NSW
80.0 LAKE ARGYLE RESORT E Kimberley WA
78.8 ELSEY N Rivers NT
75.2 FOX RIVER E Kimberley WA
74.0 KURANDA RAILWAY STATION N Coast--Barron QLD
WESTERN AUSTRALIA
E Kimberley
80.0 LAKE ARGYLE RESORT
75.2 FOX RIVER
NORTHERN TERRITORY
N Rivers
78.8 ELSEY
57.0 CENTRAL WATERHOUSE
56.4 KATHERINE RESEARCH FARM
50.8 EVA VALLEY
N Plateau
58.4 ELLIOTT
QUEENSLAND
N Peninsula
51.8 SCHERGER RAAF
N Coast--Barron
74.0 KURANDA RAILWAY STATION
65.0 KURANDA HILLTOP
63.0 MOSSMAN CENTRAL MILL
62.0 CAIRNS AERO
61.4 CAPE TRIBULATION STORE
61.0 JULATTEN
58.0 MEADOWBANK
Channel Country
54.0 GLENGYLE
NEW SOUTH WALES
NW Slopes N
86.0 CARODA (ROSEBERRY PARK)
Sydney--west
53.0 GALSTON (ROWLAND VILLAGE)
Illawarra
59.0 TOUGA
|
13.5 CEDUNA AMO W Agricultural SA
13.2 EAST SALE AIRPORT W Gippsland VIC
13.0 PERTH AIRPORT Lower West WA
13.0 BUNDOORA (LATROBE UNIVERSITY) E Central VIC
13.0 NORFOLK ISLAND AERO Islands ISL
13.0 WOOMERA AERODROME NW Pastoral SA
.....
2.6 MOUNT ISA AERO Gulf Country QLD
1.3 TENNANT CREEK AIRPORT N Plateau NT
0.8 GOVE AIRPORT N Rivers NT
0.7 MOREE AERO NW Plains E NSW
0.0 INVERELL RESEARCH CENTRE N Tablelands W NSW
|
1128 (47.0) MAATSUYKER ISLAND LIGHTHOUSE Southeast TAS
1009 (42.0) NORTH ISLAND Central West WA
892 (37.2) ROTTNEST ISLAND Lower West WA
869 (36.2) SCOTTS PEAK DAM W Coast TAS
846 (35.3) MOUNT WELLINGTON Southeast TAS
820 (34.2) GERALDTON AIRPORT Central West WA
788 (32.8) CARNARVON AIRPORT W Gascoyne WA
769 (32.0) GARDEN ISLAND HSF Lower West WA
767 (32.0) HARTZ MOUNTAIN (KEOGHS PIMPLE) Southeast TAS
751 (31.3) MONTAGUE ISLAND LIGHTHOUSE South Coast NSW
736 (30.7) SHARK BAY AIRPORT W Gascoyne WA
736 (30.7) THREDBO AWS Snowy Mtns NSW
722 (30.1) MOUNT HOTHAM Upper NE VIC
719 (30.0) BADGINGARRA RESEARCH STN Lower West WA
691 (28.8) HAMILTON ISLAND AIRPORT Central Coast E QLD
680 (28.3) SYDNEY AIRPORT AMO Sydney--east NSW
679 (28.3) LORD HOWE ISLAND AERO Islands ISL
670 (27.9) MOUNT READ W Coast TAS
656 (27.3) HOGAN ISLAND Islands ISL
647 (27.0) CEDUNA AMO W Agricultural SA
647 (27.0) CAPE GRIM BAPS N Coast TAS
620 (25.8) GREEN CAPE AWS South Coast NSW
614 (25.6) PORT AUGUSTA AERO W Agricultural SA
611 (25.5) LADY ELLIOT ISLAND Wide Bay/Burnett QLD
|
91/01 MONTAGUE ISLAND LIGHTHOUSE South Coast NSW
80/16 GILES METEOROLOGICAL OFFICE Interior WA
80/17 MOUNT BULLER Upper NE VIC
78/23 MAATSUYKER ISLAND LIGHTHOUSE Southeast TAS
76/15 MOREE AERO NW Plains E NSW
76/23 MOUNT WELLINGTON Southeast TAS
|
�