|
For notes on how to interpret
the data and quality control issues, see Daily Weather Summary Help.
**S** and **W** precede data flagged by the Bureau as suspicious or wrong
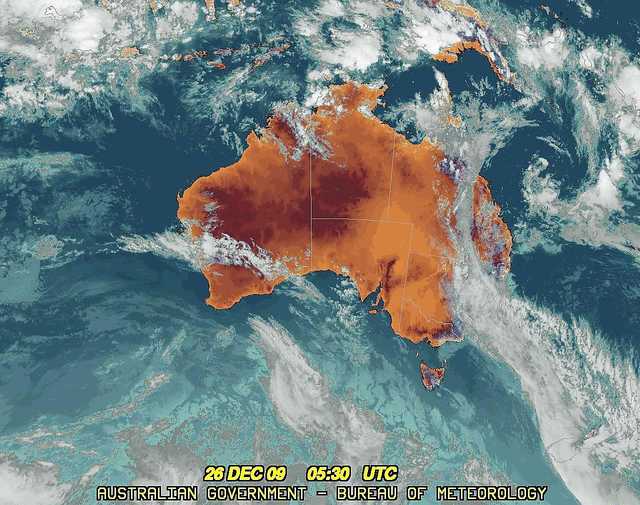
Data is as received at 11:40EST, 15/05/2012.
|
|
| |
Max
°
C |
+/- norm
°
C |
Min
°
C |
+/- norm
°
C |
Grass Min
°
C |
Rain to 9am mm |
Evaporation to 9am mm |
Sunshine hours |
Wind Run to 9am km (24-hour average km/h) |
Maximum Gust km/h / hour of occurrence |
| GERALDTON AIRPORT |
34.7 |
+5.2 |
18.1 |
+1.8 |
15.9 |
0.0 |
8.6 |
-- |
397 (16.5) |
50/16 |
| PERTH AIRPORT |
35.1 |
+6.2 |
14.4 |
-0.4 |
12.3 |
0.0 |
9.2 |
11.9 |
348 (14.5) |
39/15 |
| ALBANY AIRPORT |
24.0 |
+0.9 |
10.9 |
-1.5 |
7.6 |
0.0 |
6.8 |
10.7 |
332 (13.8) |
31/09 |
| BUNBURY |
33.6 |
+6.5 |
14.7 |
+1.4 |
-- |
0.0 |
-- |
-- |
256 (10.7) |
43/18 |
| MANDURAH |
30.9 |
-- |
20.1 |
-- |
-- |
0.0 |
-- |
-- |
323 (13.5) |
44/18 |
| DARWIN AIRPORT |
32.9 |
+0.3 |
26.2 |
+0.9 |
25.9 |
1.4 |
6.2 |
4.7 |
310 (12.9) |
37/16 |
| ALICE SPRINGS AIRPORT |
33.5 |
-1.9 |
15.7 |
-4.5 |
13.4 |
0.0 |
13.0 |
13.1 |
443 (18.5) |
52/13 |
| WHYALLA AERO |
24.5 |
-3.6 |
15.8 |
0.0 |
-- |
0.0 |
12.0 |
-- |
626 (26.1) |
44/18 |
| ADELAIDE (KENT TOWN) |
27.9 |
+0.9 |
13.0 |
-2.5 |
9.7 |
0.0 |
-- |
13.6 |
266 (11.1) |
37/12 |
| MOUNT GAMBIER AERO |
22.3 |
-0.6 |
6.4 |
-3.5 |
3.0 |
0.0 |
3.8 |
11.8 |
282 (11.8) |
37/13 |
| MOUNT ISA AERO |
35.4 |
-1.8 |
23.6 |
+0.5 |
21.7 |
0.0 |
10.2 |
11.8 |
565 (23.5) |
44/05 |
| CAIRNS AERO |
32.9 |
+1.5 |
24.7 |
+1.3 |
22.8 |
0.0 |
8.0 |
2.4 |
285 (11.9) |
28/18 |
| TOWNSVILLE AERO |
30.4 |
-1.1 |
23.1 |
-1.0 |
21.8 |
37.2 |
9.2 |
0.6 |
326 (13.6) |
35/03 |
| MACKAY M.O |
33.2 |
+3.1 |
23.0 |
+0.1 |
-- |
0.0 |
-- |
11.7 |
288 (12.0) |
26/15 |
| ROCKHAMPTON AERO |
30.9 |
-1.2 |
24.9 |
+3.7 |
24.2 |
0.0 |
8.0 |
-- |
308 (12.8) |
39/14 |
| BUNDABERG AERO |
31.4 |
+2.0 |
24.0 |
+3.5 |
-- |
3.4 |
11.4 |
-- |
403 (16.8) |
46/16 |
| NAMBOUR DPI |
29.0 |
-0.2 |
23.0 |
+4.8 |
-- |
20.0 |
-- |
-- |
-- |
-- |
| COOLANGATTA |
30.2 |
+3.0 |
23.6 |
+3.7 |
-- |
3.4 |
-- |
-- |
408 (17.0) |
34/12 |
| BRISBANE AERO |
29.0 |
+0.7 |
22.9 |
+2.8 |
22.4 |
17.0 |
5.0 |
5.9 |
539 (22.5) |
48/13 |
| TOOWOOMBA AIRPORT |
28.1 |
+0.4 |
19.2 |
+2.5 |
-- |
0.0 |
-- |
-- |
644 (26.8) |
54/15 |
| GUNNEDAH RESOURCE CENTRE |
23.3 |
-7.7 |
20.2 |
+2.7 |
15.7 |
8.4 |
5.6 |
-- |
200 ( 8.3) |
-- |
| COFFS HARBOUR MO |
27.4 |
+1.1 |
24.2 |
+6.1 |
22.6 |
0.0 |
8.8 |
2.0 |
658 (27.4) |
43/12 |
| PORT MACQUARIE AIRPORT AWS |
29.5 |
+2.9 |
19.9 |
+3.2 |
-- |
0.0 |
-- |
-- |
-- |
-- |
| WILLIAMTOWN RAAF |
20.1 |
-7.1 |
18.8 |
+2.3 |
18.3 |
7.4 |
4.4 |
0.0 |
597 (24.9) |
52/00 |
| GOSFORD (NARARA RESEARCH STATION) AWS |
20.0 |
-6.9 |
17.6 |
+2.3 |
-- |
20.2 |
-- |
-- |
167 ( 7.0) |
31/00 |
| ORANGE AGRICULTURAL INSTITUTE |
19.3 |
-5.1 |
14.9 |
+3.6 |
11.6 |
56.0 |
1.0 |
0.0 |
-- |
-- |
| DUBBO AIRPORT AWS |
23.9 |
-7.6 |
19.0 |
+3.1 |
-- |
67.6 |
-- |
-- |
340 (14.2) |
41/22 |
| SYDNEY AIRPORT AMO |
20.3 |
-5.4 |
17.6 |
+0.1 |
17.2 |
7.8 |
2.8 |
0.0 |
810 (33.8) |
54/23 |
| RICHMOND RAAF |
20.2 |
-8.5 |
16.9 |
+0.9 |
16.8 |
10.0 |
-- |
-- |
211 ( 8.8) |
21/00 |
| BELLAMBI AWS |
19.8 |
-4.3 |
16.1 |
-1.4 |
-- |
12.4 |
-- |
-- |
705 (29.4) |
44/23 |
| CANBERRA AIRPORT |
18.2 |
-7.9 |
13.3 |
+1.9 |
13.4 |
27.4 |
2.6 |
0.0 |
198 ( 8.3) |
24/14 |
| WAGGA WAGGA AMO |
25.5 |
-3.9 |
17.7 |
+4.0 |
16.2 |
2.2 |
2.8 |
4.2 |
339 (14.1) |
-- |
| ALBURY AIRPORT AWS |
31.3 |
+1.9 |
17.1 |
+3.4 |
-- |
0.0 |
-- |
-- |
219 ( 9.1) |
34/19 |
| MILDURA AIRPORT |
30.4 |
+0.3 |
12.6 |
-2.2 |
11.2 |
0.0 |
13.4 |
13.4 |
510 (21.3) |
39/13 |
| TATURA INST SUSTAINABLE AG |
28.9 |
+1.5 |
11.3 |
-0.9 |
-- |
0.0 |
-- |
-- |
600 (25.0) |
39/23 |
| BENDIGO AIRPORT |
27.4 |
+0.4 |
10.0 |
-1.5 |
-- |
0.0 |
-- |
-- |
537 (22.4) |
�
41/06 |
| MELBOURNE REGIONAL OFFICE |
22.1 |
-2.1 |
12.9 |
0.0 |
10.7 |
0.0 |
5.2 |
-- |
-- |
-- |
| GEELONG AIRPORT |
19.8 |
-3.1 |
11.1 |
+0.2 |
-- |
0.0 |
-- |
-- |
358 (14.9) |
46/16 |
| BALLARAT AERODROME |
21.2 |
-1.4 |
7.5 |
-1.9 |
-- |
0.0 |
-- |
-- |
632 (26.3) |
43/06 |
| LAUNCESTON (TI TREE BEND) |
22.1 |
-0.3 |
10.5 |
-0.1 |
-- |
0.0 |
-- |
-- |
170 ( 7.1) |
39/15 |
| HOBART AIRPORT |
21.5 |
+0.9 |
9.4 |
-1.3 |
5.9 |
0.0 |
5.6 |
11.9 |
337 (14.0) |
31/12 |
| |
Max
°
C |
+/- norm
°
C |
Min
°
C |
+/- norm
°
C |
Grass Min
°
C |
Rain to 9am mm |
Evaporation to 9am mm |
Sunshine hours |
Wind Run to 9am km |
Maximum Gust km/h / hour of occurrence |
|
| Hottest |
| Highest maximum temperature> | Greatest variation above normal maximum |
Highest minimum temperature | Greatest variation above normal minimum |
42.4 EMU CREEK STATION W Gascoyne WA
41.7 CUNDERDIN AIRFIELD Cent Wheatbelt WA
41.3 GASCOYNE JUNCTION W Gascoyne WA
41.0 CURTIN AERO W Kimberley WA
41.0 WITTENOOM W Pilbara WA
41.0 HYDEN Cent Wheatbelt WA
41.0 KELLERBERRIN Cent Wheatbelt WA
|
+14.8 : 39.3 ESPERANCE Lower West WA
+13.1 : 38.7 ESPERANCE AERO Lower West WA
+11.4 : 37.3 JACUP Cent Wheatbelt WA
+10.6 : 37.9 RAVENSTHORPE Cent Wheatbelt WA
+9.8 : 39.0 NEWDEGATE RES.STATION Cent Wheatbelt WA
|
29.6 MORNINGTON ISLAND Gulf Country QLD
28.9 WITTENOOM W Pilbara WA
28.8 CENTRE ISLAND N Rivers NT
28.7 BLACK POINT N Rivers NT
28.7 ARGYLE AERODROME E Kimberley WA
|
+8.4 : 23.0 BARRABA POST OFFICE NW Slopes N NSW
+8.4 : 19.0 WOOLBROOK (DANGLEMAH ROAD) NW Slopes S NSW
+8.1 : 21.7 INVERELL (RAGLAN ST) N Tablelands W NSW
+7.4 : 24.3 MULLEWA Central West WA
+7.3 : 18.4 ARMIDALE (TREE GROUP NURSERY) N Tablelands W NSW
|
| Coldest |
| Lowest maximum temperature | Greatest variation below normal maximum |
Lowest minimum temperature | Greatest variation below normal minimum |
12.0 MOUNT GININI AWS Goulburn/Monaro NSW
12.9 MT HOTHAM Upper NE VIC
13.3 MT BAW BAW W Gippsland VIC
13.4 THREDBO AWS Snowy Mtns NSW
13.6 MOUNT WELLINGTON Southeast TAS
|
-10.3 : 15.9 GOULBURN AIRPORT AWS Goulburn/Monaro NSW
-10.1 : 23.6 COONAMBLE COMPARISON CW Plains N NSW
-10.1 : 20.2 SCONE AIRPORT AWS Hunter Valley NSW
-10.0 : 20.9 WEST WYALONG AIRPORT AWS CW Plains S NSW
-10.0 : 20.6 WYALONG POST OFFICE SW Slopes N NSW
|
0.1 LAKE ST CLAIR NATIONAL PARK Central Plateau TAS
1.0 BUTLERS GORGE Central Plateau TAS
1.9 MOUNT BAW BAW W Gippsland VIC
2.4 MOUNT READ W Coast TAS
2.9 MOUNT WELLINGTON Southeast TAS
|
-6.8 : 15.2 WATARRKA N Plateau NT
-6.2 : 4.6 PORTLAND (CASHMORE AIRPORT) W Coast VIC
-6.1 : 5.5 HORSHAM (POLKEMMET) Wimmera S VIC
-6.0 : 3.9 WARRNAMBOOL AIRPORT NDB W Coast VIC
-5.5 : 15.0 KULGERA N Plateau NT
-5.5 : 3.5 MORTLAKE RACECOURSE W Coast VIC
|
|
Sunniest &
dullest |
Windiest |
Highest gusts |
Todays highest rainfall totals for the 24 hours to 9am. It
includes the top 5 totals nationally followed by all reported falls of 50mm or more. |
Highest
and lowest recordings of hours of sunshine for the 24 hours to midnight. |
Highest wind
run totals in kilometres for the 24 hours to 9am (average speed in brackets).
All reported runs >
=25km/h are shown. |
Highest wind
gusts in km/h for the 24 hours to midnight followed by the hour in which it occurred.
All stations with gusts >
89km/h are shown. |
144.0 BREWARRINA (YAPPALEE) Upper Darling NSW
117.2 ARTHURVILLE (CRAMOND) CW Slopes S NSW
116.8 BREWARRINA (EUMARRA) Upper Darling NSW
112.2 KAHMOO Warrego QLD
107.4 ENNGONIA (BELALIE) Upper Darling NSW
NORTHERN TERRITORY
N Rivers
80.4 LAKEFIELD
75.0 MATARANKA COUNCIL
71.0 EMERALD SPRINGS
70.2 PINE CREEK COUNCIL
68.2 GORRIE
62.8 DARWIN RIVER DAM
61.2 BERRY SPRINGS RANGERS
60.4 CENTRAL WATERHOUSE
57.0 BRADSHAW
56.2 CENTRAL ARNHEM PLATEAU
53.0 SNOWDROP CREEK
QUEENSLAND
N Peninsula
55.0 STRATHBURN STATION
52.0 STRATHMAY STATION
S Peninsula
96.0 PINNACLE
90.0 KOOLBURRA
88.6 PALMERVILLE
Gulf Country
59.8 KOWANYAMA AIRPORT
59.8 NORMANTON AIRPORT
59.0 VANROOK STATION
52.0 YAPPAR RIVER
Upper Carpentaria
83.0 GILBERTON
83.0 BAGSTOWE STATION
71.8 ZARA STATION
68.8 GEORGETOWN AIRPORT
64.6 LYNDHURST STATION
61.0 MOUNT TURNER STATION
58.6 PENTLAND POST OFFICE
N Coast--Barron
67.0 MT GARNET ALERT
62.0 RAVENSHOE KURADILLA STREET
60.0 RAVENSHOE BINBROOK ESTATE
58.6 WOODLEIGH
58.0 INNOT HOT SPRINGS TOWNSHIP
55.0 EVELYN STATE FOREST
50.0 MT GARNET POST OFFICE
N Coast--Herbert
61.0 GLENEAGLE ALERT
58.4 NEW MOON STATION
Central Coast E
79.0 FLETCHER VIEW STATION
Central Coast W
66.2 HOLMVALE
65.0 SLOGAN DOWNS
Central West
93.6 TIREE
Brisbane/SE Coast
65.0 MAROON DAM
57.0 MOUNT COTTON WEST
50.8 REGENTS PARK
50.0 MACLEAY ISLAND
Warrego
112.2 KAHMOO
70.1 KENILWORTH
66.0 HEATHER STATION
52.6 CUNNAMULLA POST OFFICE
NEW SOUTH WALES
Upper Darling
144.0 BREWARRINA (YAPPALEE)
116.8 BREWARRINA (EUMARRA)
107.4 ENNGONIA (BELALIE)
103.8 WEILMORINGLE (CARINGLE)
97.0 BARRINGUN
94.0 BREWARRINA HOSPITAL
82.0 LIGHTNING RIDGE POST OFFICE
69.5 HUNGERFORD (WILLARA)
51.0 ANGLEDOOL (ANGLEDOOL STATION)
CW Plains S
79.4 BURCHER POST OFFICE
70.0 DANDALOO (KELVIN)
69.0 TOTTENHAM (BURDENDA)
61.0 TOTTENHAM (EUAMBELINE)
51.2 PEAK HILL POST OFFICE
CW Plains N
93.0 QUAMBONE STATION
86.8 QUAMBONE (SANDY CAMP)
81.8 COONAMBLE COMPARISON
81.0 MARRA CREEK (WOMBOIN)
74.6 COONAMBLE AIRPORT AWS
69.6 TRANGIE RESEARCH STATION AWS
65.6 NEVERTIRE (CLYDE ST)
61.0 GULARGAMBONE (YALCOGRIN ST)
61.0 GILGANDRA (CHELMSFORD AVE)
60.6 NYNGAN (FAIRVIEW)
59.5 CURBAN (ERCILDOUNE)
59.4 COONAMBLE (MYALL DOWNS)
58.0 WARREN (ELLERSLIE)
58.0 NARROMINE (MUMBLE PEG)
56.5 WARREN (FRAWLEY ST)
55.0 EUMUNGERIE POST OFFICE
54.2 GILGANDRA COUNCIL DEPOT
54.0 NEVERTIRE (HEATHERBRAE)
53.0 NARROMINE (ALAGALAH ST)
51.0 MACQUARIE MARSHES (WILLIE RETREAT)
50.2 WYANGA (BARCOO)
50.0 NYNGAN (CANONBAR)
NW Plains W
73.0 COME BY CHANCE STORE
71.2 WALGETT COUNCIL DEPOT
70.0 CRYON (KOOTHNEY)
69.2 WALGETT AIRPORT AWS
56.0 PILLIGA POST OFFICE
NW Plains E
78.0 BARADINE (WOODVILLE)
57.0 KENEBRI (ELLERSLIE)
C Tablelands N
95.4 STUART TOWN (CANOBLA)
90.8 EUCHAREENA (MOLONG RD)
85.0 MOLONG (FERNLEIGH)
74.2 MOLONG (BONNIE DOON)
68.6 MOLONG (FERNLEIGH -TM)
68.6 MUMBIL (BURRENDONG DAM)
63.4 MUDGEE AIRPORT AWS
63.4 BUDGEE BUDGEE (BOTOBOLAR VINEYARD)
56.0 HARGRAVES (THE ELDERS)
55.8 MUDGEE (GEORGE STREET)
54.6 GOOLMA (BROOKLYN)
51.4 GULGONG POST OFFICE
C Tablelands S
70.0 WEST BATHURST
69.6 ORANGE (CLIFTON GROVE (CONROY PLACE))
67.8 BATHURST AGRICULTURAL STATION
65.0 HILL END POST OFFICE
62.4 ROCK FOREST (BIMBIL)
60.0 THE LAGOON (SPRINGFIELD)
56.0 ORANGE AGRICULTURAL INSTITUTE
56.0 BATHURST STANLEY STREET (MACQUARIE RIVER
52.2 BATHURST AIRPORT AWS
CW Slopes N
87.6 COONABARABRAN (MIRRIGUNDI)
64.6 ELONG ELONG (BENDEELA ST)
64.0 MENDOORAN POST OFFICE
62.0 COBBORA (ELLISMAYNE)
59.0 GILGANDRA (WALLUMBURRAWANG)
56.0 COONABARABRAN (BARINA)
CW Slopes S
117.2 ARTHURVILLE (CRAMOND)
100.0 YEOVAL POST OFFICE
95.4 CUMNOCK (WILLOW PARK)
95.2 CUMNOCK TM
95.0 DUBBO (MENTONE)
87.2 NEUREA (FERNFIELD)
81.0 WELLINGTON (AGROWPLOW)
70.2 GEURIE POST OFFICE
67.6 DUBBO AIRPORT AWS
64.2 FORBES (BIMBIMBI)
61.8 MOLONG (KING ST)
60.0 DUBBO (WILBERTREE)
58.0 DUBBO (JEMALUANG)
56.6 MOLONG TM
54.8 DUBBO (MOGRIGUY (KYARRA))
52.6 GEURIE (KURRABRI)
Goulburn/Monaro
86.8 DALTON (MILVERTON)
73.0 COLLECTOR (WINDERADEEN)
66.8 GURRUNDAH (WANDONGA)
62.8 RYE PARK (BARRACKVILLE)
62.2 YASS (LINTON HOSTEL)
61.0 GUNNING RURAL SUPPLIES
60.0 GOULBURN (SPRINGFIELD)
60.0 GUNDAROO STORE
58.0 WINDELLAMA (PINDAROO)
53.0 LAKE BATHURST (SOMERTON)
53.0 GOULBURN (KIPPILAW)
51.8 BOOROWA POST OFFICE
SW Slopes N
79.6 WOOLGARLO (ILDEMERE)
74.0 BUMBALDRY (GOLD 'N' GROVE)
73.4 YOUNG (KIAH)
70.2 BOWNING (WANGANUI)
62.2 MURRINGO (YALLAMBEE)
60.2 YOUNG AIRPORT
|
13.6 ADELAIDE (KENT TOWN) Adelaide/Lofty SA
13.5 WOOMERA AERODROME NW Pastoral SA
13.4 CEDUNA AMO W Agricultural SA
13.4 MILDURA AIRPORT Mallee N VIC
13.3 GILES METEOROLOGICAL OFFICE Interior WA
.....
**W** 0.0 WARWICK Darling Downs E QLD
0.0 MOREE AERO NW Plains E NSW
0.0 WILLIAMTOWN RAAF Hunter Valley NSW
0.0 COWRA RESEARCH CENTRE (EVANS ST) C Tablelands S NSW
0.0 ORANGE AGRICULTURAL INSTITUTE C Tablelands S NSW
0.0 WELLINGTON (AGROWPLOW) CW Slopes S NSW
0.0 SYDNEY AIRPORT AMO Sydney--east NSW
0.0 CANBERRA AIRPORT Goulburn/Monaro NSW
|
947 (39.5) MAATSUYKER ISLAND LIGHTHOUSE Southeast TAS
878 (36.6) MONTAGUE ISLAND LIGHTHOUSE South Coast NSW
819 (34.1) GREEN CAPE AWS South Coast NSW
819 (34.1) GABO ISLAND LIGHTHOUSE E Gippsland VIC
810 (33.8) SYDNEY AIRPORT AMO Sydney--east NSW
778 (32.4) WALLAN (KILMORE GAP) N Central VIC
773 (32.2) NORAH HEAD AWS Hunter Valley NSW
735 (30.6) CAPE GRIM BAPS N Coast TAS
723 (30.1) LORD HOWE ISLAND AERO Islands ISL
722 (30.1) CAPE MORETON LIGHTHOUSE Brisbane/SE Coast QLD
722 (30.1) MANGALORE AIRPORT N Central VIC
705 (29.4) BELLAMBI AWS Illawarra NSW
687 (28.6) PORT AUGUSTA AERO W Agricultural SA
667 (27.8) NORFOLK ISLAND AERO Islands ISL
**S** 658 (27.4) COFFS HARBOUR MO MidNorth Coast N NSW
650 (27.1) NEWCASTLE NOBBYS SIGNAL STATION AWS Hunter Valley NSW
650 (27.1) HARTZ MOUNTAIN (KEOGHS PIMPLE) Southeast TAS
646 (26.9) ROXBY DOWNS (OLYMPIC DAM AERODROME) NW Pastoral SA
644 (26.8) TOOWOOMBA AIRPORT Darling Downs E QLD
638 (26.6) MOOMBA AIRPORT NE Pastoral SA
636 (26.5) WOOMERA AERODROME NW Pastoral SA
632 (26.3) BALLARAT AERODROME Western Plains VIC
631 (26.3) BALLERA GAS FIELD Far SW QLD
626 (26.1) WHYALLA AERO W Agricultural SA
614 (25.6) ROTTNEST ISLAND Lower West WA
613 (25.5) OAKEY AERO Darling Downs E QLD
608 (25.3) YUNTA AIRSTRIP Northeast SA
606 (25.3) MARREE AERO NE Pastoral SA
604 (25.2) BIRDSVILLE AIRPORT Channel Country QLD
603 (25.1) RUNDLE ISLAND Wide Bay/Burnett QLD
601 (25.0) MOREE AERO NW Plains E NSW
600 (25.0) BYRON BAY (CAPE BYRON AWS) North Coast NSW
600 (25.0) TATURA INST SUSTAINABLE AG Upper North VIC
|
80/17 MEEKATHARRA AIRPORT E Gascoyne WA
72/16 CAPE NATURALISTE Lower West WA
68/16 MIDDLE POINT AWS N Rivers NT
68/15 DALBY AIRPORT Darling Downs E QLD
67/03 NEWCASTLE NOBBYS SIGNAL STATION AWS Hunter Valley NSW
|
�