|
For notes on how to interpret
the data and quality control issues, see Daily Weather Summary Help.
**S** and **W** precede data flagged by the Bureau as suspicious or wrong
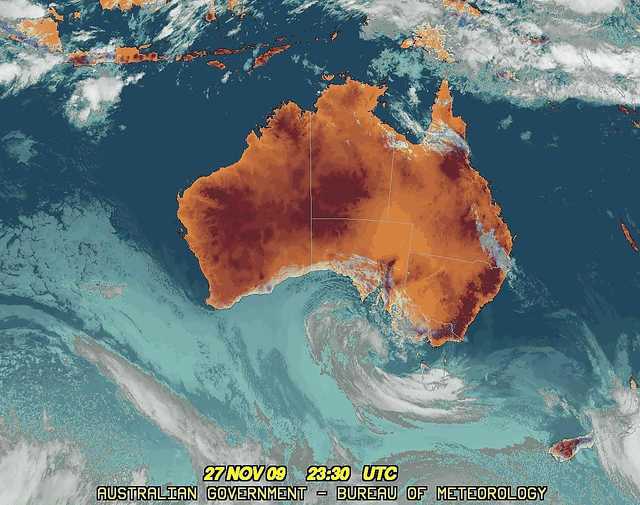
Data is as received at 08:36EST, 15/05/2012.
|
|
| |
Max
°
C |
+/- norm
°
C |
Min
°
C |
+/- norm
°
C |
Grass Min
°
C |
Rain to 9am mm |
Evaporation to 9am mm |
Sunshine hours |
Wind Run to 9am km (24-hour average km/h) |
Maximum Gust km/h / hour of occurrence |
| GERALDTON AIRPORT |
35.6 |
+8.5 |
8.7 |
-5.1 |
5.4 |
0.0 |
9.4 |
-- |
521 (21.7) |
43/07 |
| PERTH AIRPORT |
31.6 |
+5.8 |
9.9 |
-2.7 |
8.1 |
0.0 |
7.2 |
13.1 |
516 (21.5) |
65/05 |
| ALBANY AIRPORT |
19.8 |
-1.0 |
12.2 |
+1.4 |
11.8 |
0.0 |
4.0 |
11.4 |
257 (10.7) |
46/14 |
| BUNBURY |
25.7 |
+1.5 |
10.2 |
-1.8 |
-- |
0.0 |
-- |
-- |
376 (15.7) |
35/06 |
| MANDURAH |
27.4 |
-- |
12.8 |
-- |
-- |
0.0 |
-- |
-- |
424 (17.7) |
31/06 |
| DARWIN AIRPORT |
32.8 |
-0.5 |
25.6 |
+0.3 |
25.5 |
0.0 |
5.0 |
6.7 |
237 ( 9.9) |
50/16 |
| ALICE SPRINGS AIRPORT |
32.5 |
-1.1 |
18.6 |
+0.7 |
15.6 |
0.0 |
13.4 |
13.0 |
406 (16.9) |
39/10 |
| WHYALLA AERO |
24.6 |
-1.9 |
15.0 |
+1.1 |
-- |
0.0 |
15.4 |
-- |
646 (26.9) |
72/14 |
| ADELAIDE (KENT TOWN) |
20.3 |
-4.8 |
13.2 |
-0.8 |
13.1 |
15.0 |
-- |
3.7 |
512 (21.3) |
74/14 |
| MOUNT GAMBIER AERO |
17.7 |
-2.7 |
11.3 |
+2.9 |
9.9 |
16.2 |
7.6 |
3.5 |
462 (19.3) |
54/11 |
| MOUNT ISA AERO |
39.5 |
+3.1 |
22.4 |
+1.0 |
21.0 |
0.0 |
7.2 |
10.3 |
205 ( 8.5) |
37/18 |
| CAIRNS AERO |
29.5 |
-1.1 |
21.3 |
-1.0 |
19.6 |
0.0 |
6.4 |
10.5 |
250 (10.4) |
30/12 |
| TOWNSVILLE AERO |
31.9 |
+1.1 |
23.3 |
+0.4 |
20.7 |
0.0 |
9.4 |
11.8 |
359 (15.0) |
34/12 |
| MACKAY M.O |
31.9 |
+2.7 |
22.7 |
+1.0 |
-- |
0.0 |
-- |
10.8 |
225 ( 9.4) |
30/16 |
| ROCKHAMPTON AERO |
37.0 |
+5.8 |
21.0 |
+1.5 |
19.4 |
0.0 |
8.2 |
-- |
265 (11.0) |
39/17 |
| BUNDABERG AERO |
30.8 |
+2.5 |
21.8 |
+2.9 |
-- |
0.0 |
8.4 |
-- |
254 (10.6) |
43/16 |
| NAMBOUR DPI |
37.0 |
+9.0 |
21.0 |
+4.7 |
-- |
0.0 |
-- |
-- |
-- |
-- |
| COOLANGATTA |
29.1 |
+3.3 |
22.5 |
+4.3 |
-- |
0.0 |
-- |
-- |
566 (23.6) |
44/16 |
| BRISBANE AERO |
31.2 |
+4.4 |
20.9 |
+2.9 |
18.7 |
0.0 |
10.0 |
6.4 |
588 (24.5) |
48/17 |
| TOOWOOMBA AIRPORT |
32.9 |
+7.2 |
21.4 |
+6.9 |
-- |
0.8 |
-- |
-- |
332 (13.8) |
39/12 |
| GUNNEDAH RESOURCE CENTRE |
39.2 |
+10.9 |
19.4 |
+4.4 |
12.1 |
0.0 |
9.0 |
-- |
157 ( 6.5) |
-- |
| COFFS HARBOUR MO |
29.8 |
+4.9 |
19.2 |
+3.1 |
17.2 |
0.0 |
5.2 |
9.9 |
389 (16.2) |
52/15 |
| PORT MACQUARIE AIRPORT AWS |
30.6 |
+5.7 |
16.9 |
+1.9 |
-- |
0.0 |
-- |
-- |
-- |
-- |
| WILLIAMTOWN RAAF |
37.0 |
+11.6 |
16.7 |
+2.4 |
14.8 |
0.2 |
12.8 |
11.7 |
382 (15.9) |
41/15 |
| GOSFORD (NARARA RESEARCH STATION) AWS |
37.1 |
+12.0 |
16.4 |
+3.3 |
-- |
0.0 |
-- |
-- |
84 ( 3.5) |
31/13 |
| ORANGE AGRICULTURAL INSTITUTE |
27.0 |
+5.9 |
12.7 |
+3.6 |
7.6 |
0.0 |
6.8 |
10.9 |
-- |
-- |
| DUBBO AIRPORT AWS |
33.8 |
+5.4 |
16.4 |
+2.8 |
-- |
0.0 |
-- |
-- |
295 (12.3) |
46/14 |
| SYDNEY AIRPORT AMO |
33.3 |
+9.3 |
21.3 |
+6.0 |
16.0 |
0.0 |
12.8 |
9.5 |
380 (15.8) |
63/16 |
| RICHMOND RAAF |
40.2 |
+13.6 |
15.2 |
+1.3 |
10.9 |
0.2 |
-- |
-- |
228 ( 9.5) |
57/16 |
| BELLAMBI AWS |
25.0 |
+2.9 |
18.6 |
+3.0 |
-- |
0.0 |
-- |
-- |
243 (10.1) |
44/15 |
| CANBERRA AIRPORT |
28.0 |
+5.3 |
12.9 |
+4.1 |
10.4 |
0.0 |
6.6 |
12.3 |
289 (12.0) |
63/13 |
| WAGGA WAGGA AMO |
26.9 |
+1.2 |
18.2 |
+7.5 |
14.3 |
0.0 |
5.6 |
11.5 |
302 (12.6) |
50/14 |
| ALBURY AIRPORT AWS |
26.4 |
+0.4 |
17.1 |
+5.5 |
-- |
0.0 |
-- |
-- |
179 ( 7.5) |
52/21 |
| MILDURA AIRPORT |
23.7 |
-3.7 |
13.9 |
+1.4 |
11.1 |
1.6 |
12.2 |
10.0 |
466 (19.4) |
65/17 |
| TATURA INST SUSTAINABLE AG |
24.7 |
+0.1 |
13.1 |
+3.0 |
-- |
1.8 |
-- |
-- |
300 (12.5) |
50/18 |
| BENDIGO AIRPORT |
22.5 |
-1.7 |
11.8 |
+2.3 |
-- |
2.4 |
-- |
-- |
339 (14.1) |
�
55/15 |
| MELBOURNE REGIONAL OFFICE |
22.7 |
+0.8 |
16.3 |
+5.1 |
13.4 |
4.8 |
5.2 |
-- |
-- |
-- |
| GEELONG AIRPORT |
23.5 |
+2.5 |
11.5 |
+1.9 |
-- |
11.8 |
-- |
-- |
381 (15.9) |
67/00 |
| BALLARAT AERODROME |
18.1 |
-1.5 |
8.7 |
+0.9 |
-- |
12.2 |
-- |
-- |
504 (21.0) |
48/12 |
| LAUNCESTON (TI TREE BEND) |
20.0 |
-0.4 |
12.1 |
+3.2 |
-- |
11.6 |
-- |
-- |
246 (10.3) |
50/00 |
| HOBART AIRPORT |
15.3 |
-3.7 |
11.5 |
+2.3 |
10.7 |
6.0 |
1.8 |
0.0 |
314 (13.1) |
30/12 |
| |
Max
°
C |
+/- norm
°
C |
Min
°
C |
+/- norm
°
C |
Grass Min
°
C |
Rain to 9am mm |
Evaporation to 9am mm |
Sunshine hours |
Wind Run to 9am km |
Maximum Gust km/h / hour of occurrence |
|
| Hottest |
| Highest maximum temperature> | Greatest variation above normal maximum |
Highest minimum temperature | Greatest variation above normal minimum |
44.2 FITZROY CROSSING AERO W Kimberley WA
44.1 WYNDHAM AERO N Kimberley WA
44.0 WARMUN E Kimberley WA
43.5 ARGYLE AERODROME E Kimberley WA
43.4 RABBIT FLAT N Plateau NT
|
+15.2 : 35.8 NAROOMA RVCP South Coast NSW
+14.5 : 39.8 SYDNEY OLYMPIC PARK (SYDNEY OLYMPIC PK A Sydney--east NSW
+14.2 : 39.5 PROSPECT RESERVOIR Sydney--west NSW
+14.0 : 39.2 BANKSTOWN AIRPORT AWS Sydney--east NSW
+13.9 : 39.5 NEWCASTLE UNIVERSITY Hunter Valley NSW
|
30.0 NORTHERN ENDEAVOUR Islands ISL
29.8 WYNDHAM N Kimberley WA
29.0 TROUGHTON ISLAND N Kimberley WA
28.8 KIDMAN SPRINGS N Rivers NT
28.5 CROYDON TOWNSHIP Gulf Country QLD
|
+9.9 : 25.7 INJUNE POST OFFICE Maranoa QLD
+9.1 : 22.8 WARWICK Darling Downs E QLD
+8.9 : 24.8 CASINO AIRPORT North Coast NSW
+8.5 : 24.3 CASINO AIRPORT AWS North Coast NSW
+8.2 : 19.7 APPLETHORPE Darling Downs E QLD
|
| Coldest |
| Lowest maximum temperature | Greatest variation below normal maximum |
Lowest minimum temperature | Greatest variation below normal minimum |
9.0 MT HOTHAM Upper NE VIC
9.0 HARTZ MOUNTAIN (KEOGHS PIMPLE) Southeast TAS
10.0 GRAMPIANS (MOUNT WILLIAM) Wimmera S VIC
10.0 WARRA W Coast TAS
10.2 MOUNT READ W Coast TAS
|
-8.0 : 14.1 MOUNT CRAWFORD FIRE TOWER Adelaide/Lofty SA
-7.5 : 21.3 MINNIPA DPI W Agricultural SA
-7.4 : 21.2 KYANCUTTA W Agricultural SA
-7.2 : 22.2 WUDINNA AERO W Agricultural SA
-7.2 : 22.0 HAWKER Upper North SA
|
3.0 MOUNT WELLINGTON Southeast TAS
3.3 JACUP Cent Wheatbelt WA
3.4 MOUNT BULLER Upper NE VIC
3.6 NORSEMAN AERO Goldfields WA
3.8 BRIDGETOWN Lower West WA
|
-8.5 : 3.6 NORSEMAN AERO Goldfields WA
-7.3 : 4.9 NORSEMAN Goldfields WA
-6.4 : 3.3 JACUP Cent Wheatbelt WA
-5.9 : 4.1 NEWDEGATE RESEARCH STATION Cent Wheatbelt WA
-5.9 : 10.3 YEELIRRIE Goldfields WA
|
|
Sunniest &
dullest |
Windiest |
Highest gusts |
Todays highest rainfall totals for the 24 hours to 9am. It
includes the top 5 totals nationally followed by all reported falls of 50mm or more. |
Highest
and lowest recordings of hours of sunshine for the 24 hours to midnight. |
Highest wind
run totals in kilometres for the 24 hours to 9am (average speed in brackets).
All reported runs >
=25km/h are shown. |
Highest wind
gusts in km/h for the 24 hours to midnight followed by the hour in which it occurred.
All stations with gusts >
89km/h are shown. |
55.6 ALMORA STATION Gulf Country QLD
47.2 HORN ISLAND N Peninsula QLD
47.0 CAPE GRIM (WOOLNORTH) N Coast TAS
41.4 LOONGANA (SERENDIPITY) N Coast TAS
41.0 LAMBELL'S LAGOON N Rivers NT
NORTHERN TERRITORY
N Rivers
41.0 LAMBELL'S LAGOON
QUEENSLAND
N Peninsula
47.2 HORN ISLAND
Gulf Country
55.6 ALMORA STATION
TASMANIA
N Coast
47.0 CAPE GRIM (WOOLNORTH)
41.4 LOONGANA (SERENDIPITY)
|
13.3 GILES METEOROLOGICAL OFFICE Interior WA
13.1 PERTH AIRPORT Lower West WA
13.1 MOREE AERO NW Plains E NSW
13.1 NORFOLK ISLAND AERO Islands ISL
13.0 ALICE SPRINGS AIRPORT N Plateau NT
.....
**W** 0.0 WARWICK Darling Downs E QLD
0.0 BICHENO (COUNCIL DEPOT) E Coast TAS
0.0 LAKE LEAKE (ELIZABETH RIVER) E Coast TAS
0.0 HOBART AIRPORT Southeast TAS
0.0 STRATHGORDON VILLAGE W Coast TAS
|
1193 (49.7) NEPTUNE ISLAND W Agricultural SA
972 (40.5) MOUNT HOTHAM Upper NE VIC
945 (39.4) CEDUNA AMO W Agricultural SA
**S** 922 (38.4) HOGAN ISLAND Islands ISL
919 (38.3) MINLATON AERO Yorke Pen/Kanga Is SA
917 (38.2) SNOWTOWN (RAYVILLE PARK) Lower North SA
906 (37.8) SWAN ISLAND E Coast TAS
893 (37.2) CAPE GRIM BAPS N Coast TAS
852 (35.5) WILSONS PROMONTORY LIGHTHOUSE W Gippsland VIC
845 (35.2) CAPE BORDA Yorke Pen/Kanga Is SA
824 (34.3) NORTH SHIELDS (PORT LINCOLN AWS) W Agricultural SA
802 (33.4) NULLARBOR W Agricultural SA
801 (33.4) ADELAIDE AIRPORT Adelaide/Lofty SA
778 (32.4) FALLS CREEK Upper NE VIC
767 (32.0) WUDINNA AERO W Agricultural SA
765 (31.9) CLEVE AERODROME W Agricultural SA
760 (31.7) COULTA (COLES POINT) W Agricultural SA
757 (31.5) SMITHTON AERODROME N Coast TAS
756 (31.5) WOOMERA AERODROME NW Pastoral SA
755 (31.5) COOBER PEDY AIRPORT NW Pastoral SA
754 (31.4) EDINBURGH RAAF Adelaide/Lofty SA
752 (31.3) TARCOOLA AERO NW Pastoral SA
749 (31.2) MOUNT CRAWFORD FIRE TOWER Adelaide/Lofty SA
743 (31.0) ROSEWORTHY AWS Adelaide/Lofty SA
739 (30.8) CAPE MORETON LIGHTHOUSE Brisbane/SE Coast QLD
738 (30.8) MINNIPA DPI W Agricultural SA
730 (30.4) STENHOUSE BAY Yorke Pen/Kanga Is SA
725 (30.2) CAPE WILLOUGHBY Yorke Pen/Kanga Is SA
713 (29.7) YUNTA AIRSTRIP Northeast SA
707 (29.5) MOUNT BULLER Upper NE VIC
696 (29.0) EDITHBURGH Yorke Pen/Kanga Is SA
684 (28.5) BYRON BAY (CAPE BYRON AWS) North Coast NSW
678 (28.3) MARREE AERO NE Pastoral SA
677 (28.2) NORTH ISLAND Central West WA
668 (27.8) PORT AUGUSTA AERO W Agricultural SA
668 (27.8) MOUNT READ W Coast TAS
667 (27.8) EDDYSTONE POINT E Coast TAS
655 (27.3) ROTTNEST ISLAND Lower West WA
654 (27.3) STRATHALBYN RACECOURSE Murray Valley SA
649 (27.0) CAPE JAFFA (THE LIMESTONE) Lower SE SA
646 (26.9) WHYALLA AERO W Agricultural SA
645 (26.9) LEIGH CREEK AIRPORT NE Pastoral SA
635 (26.5) MOOMBA AIRPORT NE Pastoral SA
635 (26.5) LUNCHEON HILL (FORESTRY) N Coast TAS
634 (26.4) ROXBY DOWNS (OLYMPIC DAM AERODROME) NW Pastoral SA
632 (26.3) PARAFIELD AIRPORT Adelaide/Lofty SA
621 (25.9) CARNARVON AIRPORT W Gascoyne WA
618 (25.8) BIRDSVILLE AIRPORT Channel Country QLD
610 (25.4) COLAC (MOUNT GELLIBRAND) W Coast VIC
606 (25.3) FORREST Eucla WA
605 (25.2) PARAWA (SECOND VALLEY FOREST AWS) Adelaide/Lofty SA
|
124/03 MOUNT HOTHAM Upper NE VIC
107/19 CAPE WILLOUGHBY Yorke Pen/Kanga Is SA
106/03 MOUNT BULLER Upper NE VIC
100/19 MOUNT CRAWFORD FIRE TOWER Adelaide/Lofty SA
100/03 MOUNT READ W Coast TAS
98/01 CAPE GRIM BAPS N Coast TAS
93/06 NEPTUNE ISLAND W Agricultural SA
93/06 WILSONS PROMONTORY LIGHTHOUSE W Gippsland VIC
91/15 SNOWTOWN (RAYVILLE PARK) Lower North SA
91/15 KUITPO FOREST RESERVE Adelaide/Lofty SA
91/19 EILDON FIRE TOWER N Central VIC
91/23 COLAC (MOUNT GELLIBRAND) W Coast VIC
|
�