|
For notes on how to interpret
the data and quality control issues, see Daily Weather Summary Help.
**S** and **W** precede data flagged by the Bureau as suspicious or wrong
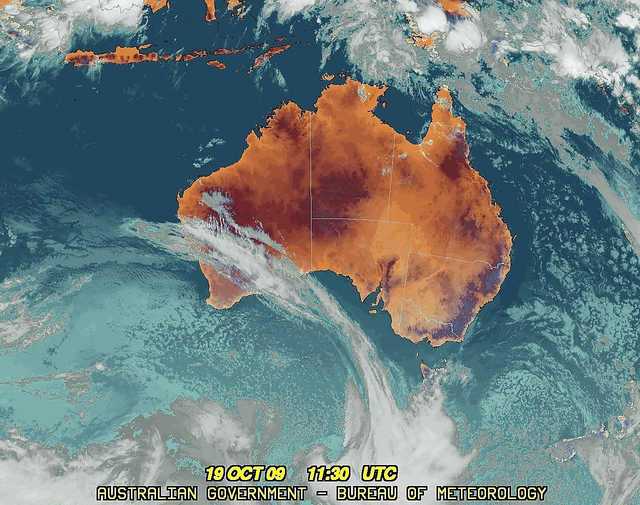
Data is as received at 06:06EST, 15/05/2012.
|
|
| |
Max
°
C |
+/- norm
°
C |
Min
°
C |
+/- norm
°
C |
Grass Min
°
C |
Rain to 9am mm |
Evaporation to 9am mm |
Sunshine hours |
Wind Run to 9am km (24-hour average km/h) |
Maximum Gust km/h / hour of occurrence |
| GERALDTON AIRPORT |
23.2 |
-1.2 |
16.3 |
+5.4 |
14.7 |
0.0 |
4.6 |
-- |
320 (13.3) |
46/20 |
| PERTH AIRPORT |
22.2 |
-0.3 |
16.1 |
+5.9 |
14.3 |
0.0 |
6.4 |
5.8 |
393 (16.4) |
35/18 |
| ALBANY AIRPORT |
17.1 |
-1.6 |
13.0 |
+3.9 |
11.3 |
0.4 |
6.8 |
10.6 |
408 (17.0) |
44/10 |
| BUNBURY |
20.3 |
-0.4 |
14.6 |
+5.4 |
-- |
0.0 |
-- |
-- |
335 (14.0) |
46/16 |
| MANDURAH |
20.3 |
-- |
16.2 |
-- |
-- |
0.0 |
-- |
-- |
335 (14.0) |
41/22 |
| DARWIN AIRPORT |
35.1 |
+1.9 |
22.3 |
-2.7 |
21.8 |
0.0 |
10.8 |
11.1 |
350 (14.6) |
35/13 |
| ALICE SPRINGS AIRPORT |
29.5 |
-1.5 |
8.1 |
-6.7 |
5.4 |
0.0 |
10.2 |
12.3 |
352 (14.7) |
39/10 |
| WHYALLA AERO |
30.9 |
+7.0 |
6.5 |
-4.0 |
-- |
0.0 |
4.0 |
-- |
218 ( 9.1) |
41/14 |
| ADELAIDE (KENT TOWN) |
27.7 |
+5.9 |
8.9 |
-2.5 |
4.5 |
0.0 |
10.8 |
12.4 |
183 ( 7.6) |
31/11 |
| MOUNT GAMBIER AERO |
21.4 |
+3.5 |
3.7 |
-3.4 |
1.2 |
0.0 |
0.6 |
12.7 |
223 ( 9.3) |
41/11 |
| MOUNT ISA AERO |
35.2 |
+0.6 |
18.5 |
-0.1 |
13.2 |
0.0 |
11.6 |
11.0 |
407 (17.0) |
39/10 |
| CAIRNS AERO |
28.9 |
-0.6 |
23.6 |
+3.0 |
22.2 |
0.0 |
10.2 |
2.8 |
549 (22.9) |
48/10 |
| TOWNSVILLE AERO |
30.1 |
+0.7 |
23.6 |
+2.9 |
22.0 |
0.0 |
11.4 |
10.8 |
665 (27.7) |
57/10 |
| MACKAY M.O |
27.5 |
-0.1 |
23.0 |
+3.3 |
-- |
0.0 |
-- |
10.9 |
493 (20.5) |
43/01 |
| ROCKHAMPTON AERO |
28.6 |
-1.1 |
17.1 |
+0.1 |
15.9 |
0.0 |
8.6 |
-- |
383 (16.0) |
37/10 |
| BUNDABERG AERO |
26.3 |
-0.6 |
15.4 |
-1.2 |
-- |
1.2 |
7.4 |
-- |
362 (15.1) |
43/10 |
| NAMBOUR DPI |
25.0 |
-1.7 |
13.0 |
-0.8 |
-- |
6.0 |
-- |
-- |
-- |
-- |
| COOLANGATTA |
24.2 |
-0.2 |
14.1 |
-2.1 |
-- |
4.8 |
-- |
-- |
274 (11.4) |
41/13 |
| BRISBANE AERO |
24.7 |
-0.8 |
13.9 |
-1.8 |
11.0 |
0.0 |
7.0 |
10.5 |
363 (15.1) |
37/13 |
| TOOWOOMBA AIRPORT |
23.6 |
-1.1 |
11.3 |
-1.5 |
-- |
0.0 |
-- |
-- |
561 (23.4) |
48/21 |
| GUNNEDAH RESOURCE CENTRE |
27.6 |
+2.5 |
11.3 |
-0.8 |
6.1 |
0.0 |
6.0 |
-- |
122 ( 5.1) |
-- |
| COFFS HARBOUR MO |
22.6 |
-1.0 |
12.0 |
-1.8 |
11.6 |
10.0 |
6.0 |
11.9 |
224 ( 9.3) |
28/13 |
| PORT MACQUARIE AIRPORT AWS |
23.7 |
-0.3 |
10.0 |
-1.9 |
-- |
0.0 |
-- |
-- |
-- |
-- |
| WILLIAMTOWN RAAF |
23.5 |
-0.1 |
6.3 |
-5.7 |
4.4 |
0.0 |
4.8 |
12.3 |
248 (10.3) |
35/13 |
| GOSFORD (NARARA RESEARCH STATION) AWS |
23.0 |
-0.7 |
6.9 |
-3.8 |
5.0 |
0.4 |
-- |
-- |
49 ( 2.0) |
26/11 |
| ORANGE AGRICULTURAL INSTITUTE |
19.6 |
+2.1 |
3.5 |
-3.1 |
-0.5 |
0.0 |
2.2 |
11.2 |
-- |
-- |
| DUBBO AIRPORT AWS |
27.1 |
+2.3 |
7.4 |
-2.0 |
-- |
0.0 |
-- |
-- |
254 (10.6) |
30/11 |
| SYDNEY AIRPORT AMO |
22.0 |
-0.5 |
12.8 |
-0.3 |
7.9 |
0.4 |
4.4 |
12.2 |
306 (12.8) |
30/13 |
| RICHMOND RAAF |
25.1 |
+0.1 |
7.0 |
-4.0 |
3.2 |
0.0 |
-- |
-- |
110 ( 4.6) |
35/15 |
| BELLAMBI AWS |
19.8 |
-1.8 |
12.0 |
-1.9 |
-- |
0.0 |
-- |
-- |
260 (10.8) |
22/23 |
| CANBERRA AIRPORT |
20.8 |
+1.4 |
5.1 |
-1.0 |
1.2 |
0.0 |
4.2 |
12.5 |
219 ( 9.1) |
28/14 |
| WAGGA WAGGA AMO |
24.9 |
+3.5 |
3.0 |
-4.7 |
-0.3 |
0.0 |
4.8 |
12.1 |
132 ( 5.5) |
26/15 |
| ALBURY AIRPORT AWS |
22.7 |
+1.1 |
5.1 |
-2.9 |
-- |
0.0 |
-- |
-- |
72 ( 3.0) |
18/11 |
| MILDURA AIRPORT |
27.2 |
+3.4 |
5.7 |
-4.1 |
2.3 |
0.0 |
5.0 |
12.5 |
238 ( 9.9) |
24/14 |
| TATURA INST SUSTAINABLE AG |
23.3 |
+2.4 |
2.1 |
-5.4 |
-- |
1.63 |
12.4 |
-- |
255 (10.6) |
24/13 |
| BENDIGO AIRPORT |
21.7 |
+1.4 |
2.8 |
-3.5 |
-- |
0.0 |
-- |
-- |
239 (10.0) |
�
24/07 |
| MELBOURNE REGIONAL OFFICE |
21.5 |
+1.9 |
10.6 |
+1.1 |
8.3 |
0.0 |
3.0 |
-- |
-- |
-- |
| GROVEDALE (GEELONG AIRPORT) |
21.1 |
+2.3 |
8.5 |
+0.9 |
-- |
0.0 |
-- |
-- |
184 ( 7.7) |
30/15 |
| BALLARAT AERODROME |
18.6 |
+2.0 |
6.2 |
0.0 |
-- |
0.0 |
-- |
-- |
260 (10.8) |
24/13 |
| LAUNCESTON (TI TREE BEND) |
19.6 |
+1.6 |
6.4 |
-0.5 |
-- |
0.0 |
-- |
-- |
270 (11.3) |
37/15 |
| HOBART AIRPORT |
17.2 |
-0.1 |
9.5 |
+2.0 |
8.6 |
3.4 |
1.4 |
7.5 |
418 (17.4) |
39/23 |
| |
Max
°
C |
+/- norm
°
C |
Min
°
C |
+/- norm
°
C |
Grass Min
°
C |
Rain to 9am mm |
Evaporation to 9am mm |
Sunshine hours |
Wind Run to 9am km |
Maximum Gust km/h / hour of occurrence |
|
| Hottest |
| Highest maximum temperature> | Greatest variation above normal maximum |
Highest minimum temperature | Greatest variation above normal minimum |
41.4 LEARMONTH AIRPORT W Pilbara WA
40.9 EMU CREEK STATION W Gascoyne WA
40.4 MARBLE BAR E Pilbara WA
40.3 WEST ROEBUCK W Kimberley WA
40.2 ONSLOW AIRPORT W Pilbara WA
|
+16.8 : 39.7 EYRE Eucla WA
+14.9 : 37.9 EUCLA Eucla WA
+12.1 : 39.0 BALGAIR Eucla WA
+10.9 : 35.3 NULLARBOR W Agricultural SA
+10.3 : 37.4 FORREST Eucla WA
|
25.6 LOCKHART RIVER AIRPORT S Peninsula QLD
25.4 HORN ISLAND N Peninsula QLD
25.1 COCONUT ISLAND N Peninsula QLD
25.0 NORMANTON AIRPORT Gulf Country QLD
25.0 GREEN ISLAND N Coast--Barron QLD
|
+9.1 : 17.9 SOUTHERN CROSS AIRFIELD Goldfields WA
+8.8 : 22.9 MOUNT MAGNET AERO E Gascoyne WA
+8.7 : 19.9 PAYNES FIND E Gascoyne WA
+7.2 : 13.3 WANDERING Cent Wheatbelt WA
+6.8 : 15.0 HYDEN Cent Wheatbelt WA
+6.8 : 17.8 KALGOORLIE-BOULDER AIRPORT Goldfields WA
|
| Coldest |
| Lowest maximum temperature | Greatest variation below normal maximum |
Lowest minimum temperature | Greatest variation below normal minimum |
7.6 MOUNT READ W Coast TAS
8.0 MOUNT WELLINGTON Southeast TAS
8.7 THREDBO AWS Snowy Mtns NSW
8.7 MT HOTHAM Upper NE VIC
9.6 CHARLOTTE PASS (KOSCIUSKO CHALET) Snowy Mtns NSW
|
-5.9 : 18.5 BADGINGARRA RESEARCH STN Lower West WA
-5.4 : 18.8 WONGAN HILLS RES.STATION Central West WA
-5.0 : 20.0 WONGAN HILLS Central West WA
-4.5 : 32.9 RABBIT FLAT N Plateau NT
-4.3 : 26.5 MAREEBA AIRPORT N Coast--Barron QLD
-4.3 : 13.1 ORFORD (AUBIN COURT) E Coast TAS
|
-2.0 THREDBO VILLAGE Snowy Mtns NSW
-0.5 MOUNT BAW BAW W Gippsland VIC
-0.1 THREDBO AWS Snowy Mtns NSW
0.0 CHARLOTTE PASS (KOSCIUSKO CHALET) Snowy Mtns NSW
|
-11.3 : 12.2 KIDMAN SPRINGS N Rivers NT
-11.1 : 7.6 RABBIT FLAT N Plateau NT
-9.6 : 12.8 VICTORIA RIVER DOWNS N Rivers NT
-9.2 : 12.4 WAVE HILL N Rivers NT
-8.9 : 15.2 TINDAL RAAF N Rivers NT
|
|
Sunniest &
dullest |
Windiest |
Highest gusts |
Todays highest rainfall totals for the 24 hours to 9am. It
includes the top 5 totals nationally followed by all reported falls of 50mm or more. |
Highest
and lowest recordings of hours of sunshine for the 24 hours to midnight. |
Highest wind
run totals in kilometres for the 24 hours to 9am (average speed in brackets).
All reported runs >
=25km/h are shown. |
Highest wind
gusts in km/h for the 24 hours to midnight followed by the hour in which it occurred.
All stations with gusts >
89km/h are shown. |
62.0 ROLLINGSTONE N Coast--Herbert QLD
54.4 UPPER STONE EXELBY N Coast--Herbert QLD
48.0 POVERTY HILL ALERT N Coast--Herbert QLD
46.0 MUTARNEE STORE N Coast--Herbert QLD
45.0 DALBEG Central Coast E QLD
QUEENSLAND
N Coast--Herbert
62.0 ROLLINGSTONE
54.4 UPPER STONE EXELBY
48.0 POVERTY HILL ALERT
46.0 MUTARNEE STORE
Central Coast E
45.0 DALBEG
|
12.9 COBAR MO Upper Darling NSW
12.7 MOUNT GAMBIER AERO Lower SE SA
12.5 CEDUNA AMO W Agricultural SA
12.5 CANBERRA AIRPORT Goulburn/Monaro NSW
12.5 MILDURA AIRPORT Mallee N VIC
.....
4.5 GROVE (COMPARISON) Southeast TAS
4.4 BICHENO (COUNCIL DEPOT) E Coast TAS
3.6 WALKAMIN DPI N Coast--Barron QLD
2.8 CAIRNS AERO N Coast--Barron QLD
2.2 KAIRI RESEARCH STATION N Coast--Barron QLD
|
1311 (54.6) MAATSUYKER ISLAND LIGHTHOUSE Southeast TAS
1054 (43.9) MOUNT WELLINGTON Southeast TAS
1004 (41.8) HAMILTON ISLAND AIRPORT Central Coast E QLD
976 (40.7) WILLIS ISLAND Islands ISL
914 (38.1) LOW HEAD N Coast TAS
899 (37.5) FLINDERS ISLAND AIRPORT Flinders Is/Bass St TAS
831 (34.6) SCOTTS PEAK DAM W Coast TAS
819 (34.1) RUNDLE ISLAND Wide Bay/Burnett QLD
808 (33.7) CAPE GRIM BAPS N Coast TAS
786 (32.8) CAPE FLATTERY N Coast--Barron QLD
749 (31.2) HARTZ MOUNTAIN (KEOGHS PIMPLE) Southeast TAS
737 (30.7) MOUNT READ W Coast TAS
724 (30.2) MACKAY AERO Central Coast E QLD
723 (30.1) SWAN ISLAND E Coast TAS
711 (29.6) LOW ISLES LIGHTHOUSE N Coast--Barron QLD
709 (29.5) LADY ELLIOT ISLAND Wide Bay/Burnett QLD
700 (29.2) WILSONS PROMONTORY LIGHTHOUSE W Gippsland VIC
681 (28.4) ALVA BEACH Central Coast E QLD
665 (27.7) TOWNSVILLE AERO N Coast--Herbert QLD
649 (27.0) CAPE BRUNY (CAPE BRUNY) Southeast TAS
638 (26.6) EDDYSTONE POINT E Coast TAS
637 (26.5) MCCLUER ISLAND N Rivers NT
636 (26.5) CAPE MORETON LIGHTHOUSE Brisbane/SE Coast QLD
636 (26.5) DOUBLE ISLAND POINT LIGHTHOUSE Brisbane/SE Coast QLD
632 (26.3) LIAWENEE Central Plateau TAS
624 (26.0) DEVONPORT AIRPORT N Coast TAS
623 (26.0) COOKTOWN AIRPORT N Coast--Barron QLD
612 (25.5) HERON ISLAND RES STN Wide Bay/Burnett QLD
610 (25.4) HALLS CREEK AIRPORT E Kimberley WA
|
80/23 MOUNT WELLINGTON Southeast TAS
72/22 TASMAN ISLAND Southeast TAS
70/04 CAPE LEEUWIN Lower West WA
70/23 MAATSUYKER ISLAND LIGHTHOUSE Southeast TAS
65/18 WILLIS ISLAND Islands ISL
65/23 MOUNT READ W Coast TAS
|
�