Wednesday 03 JAN 2007
 

Home page

DWS ARCHIVE
2024 2023 2022 2021 2020 2019 2018 2017 2016 2015 2014 2013 2012 2011 2010 2009 2008 2007 2006 2005 2004 2003
Before 2003

About the DWS


2007

Dec

M Tu W Th F Sa Su
          01 02
03 04 05 06 07 08 09
10 11 12 13 14 15 16
17 18 19 20 21 22 23
24 25 26 27 28 29 30
31            

Nov

M Tu W Th F Sa Su
      01 02 03 04
05 06 07 08 09 10 11
12 13 14 15 16 17 18
19 20 21 22 23 24 25
26 27 28 29 30    

Oct

M Tu W Th F Sa Su
01 02 03 04 05 06 07
08 09 10 11 12 13 14
15 16 17 18 19 20 21
22 23 24 25 26 27 28
29 30 31        

Sept

M Tu W Th F Sa Su
          01 02
03 04 05 06 07 08 09
10 11 12 13 14 15 16
17 18 19 20 21 22 23
24 25 26 27 28 29 30

August

M Tu W Th F Sa Su
    01 02 03 04 05
06 07 08 09 10 11 12
13 14 15 16 17 18 19
20 21 22 23 24 25 26
27 28 29 30 31    

July

M Tu W Th F Sa Su
            01
02 03 04 05 06 07 08
09 10 11 12 13 14 15
16 17 18 19 20 21 22
23 24 25 26 27 28 29
30 31          

June

M Tu W Th F Sa Su
        01 02 03
04 05 06 07 08 09 10
11 12 13 14 15 16 17
18 19 20 21 22 23 24
25 26 27 28 29 30  

May

M Tu W Th F Sa Su
  01 02 03 04 05 06
07 08 09 10 11 12 13
14 15 16 17 18 19 20
21 22 23 24 25 26 27
28 29 30 31      

April

M Tu W Th F Sa Su
            01
02 03 04 05 06 07 08
09 10 11 12 13 14 15
16 17 18 19 20 21 22
23 24 25 26 27 28 29
30            

March

M Tu W Th F Sa Su
      01 02 03 04
05 06 07 08 09 10 11
12 13 14 15 16 17 18
19 20 21 22 23 24 25
26 27 28 29 30 31  

February

M Tu W Th F Sa Su
      01 02 03 04
05 06 07 08 09 10 11
12 13 14 15 16 17 18
19 20 21 22 23 24 25
26 27 28        

January

M Tu W Th F Sa Su
01 02 03 04 05 06 07
08 09 10 11 12 13 14
15 16 17 18 19 20 21
22 23 24 25 26 27 28
29 30 31        

Monthly summaries:
from BoM

Find a place:
Google Maps |
Aust Gazetteer|
Geonames

Weather terms:
WeatherZone | BoM |
American Met Soc | NOAA | uk.sci.weather | India Meteorological Department

National Daily Weather Summary

Records set | Charts | Cities | Hottest | Coldest | Rain, sun & wind | Downpours & gales
State extremes | Noteworthy weather | Capital Cities | Regional Cities | Alpine Stations
Charts and data courtesy Bureau of Meteorology. MTSAT-1R operated by JMA
Noteworthy weather today
significant newsworthy major

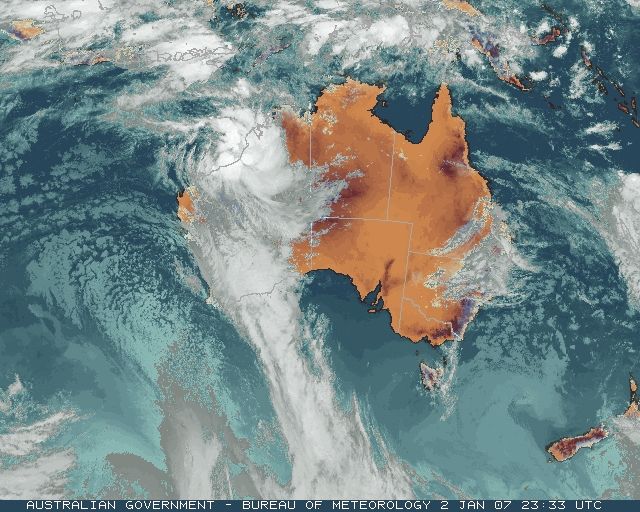
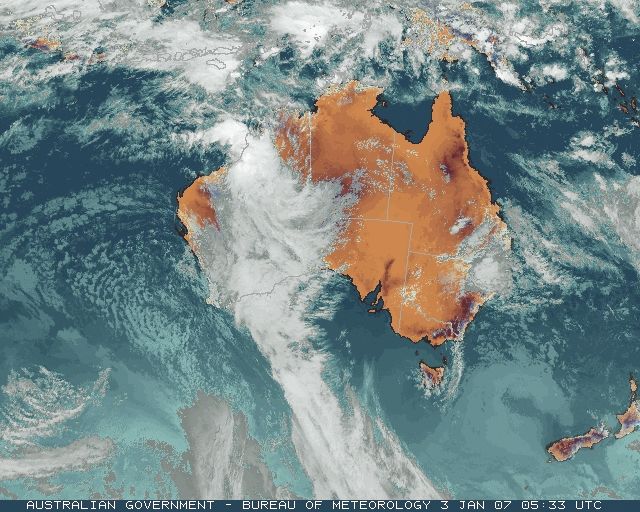
WA: TC Isobel crosses WA north coast. Tropical Cyclone Isobel crossed the northern WA coast near Pardoo, about 100km ENE of Port Hedland, soon after midday. The system continued to be a weak one, its central pressure on landfall estimated at 990hPa. It had the distinction of being multi-centred, which helped to keep it weak, but resulted in significant rain falling over a wider area. Cyclone warnings estimated winds near the cyclone would reach 100km/h; the highest recorded wind gust was 72km/h and sustained wind speed 63km/h at Barrow Island, well to the west of Isobel's track. Heavy rain preceded the cyclone during the day (see downpours) with by far the highest total 141mm between 9am and 3pm at Mandora, just east of Isobel's landfall. The cyclone weakened into a low pressure system almost immediately upon landfall, but its massive moisture and instability began interacting with a southern trough and unseasonably cold air advancing from the west as it moved into the Great Sandy Desert (see stories below and on 4 Jan 2007).

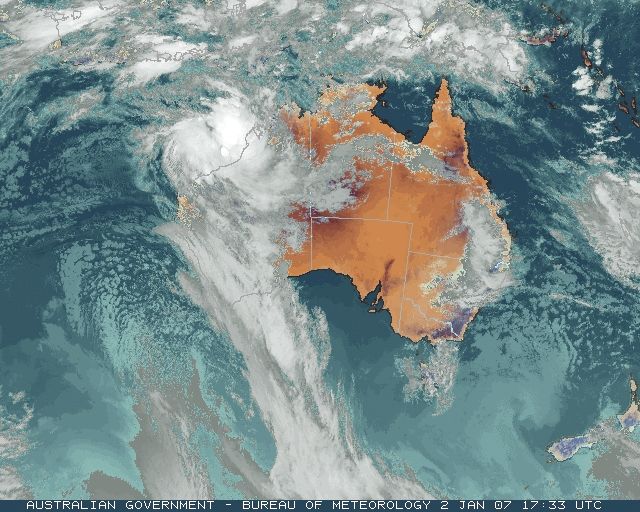
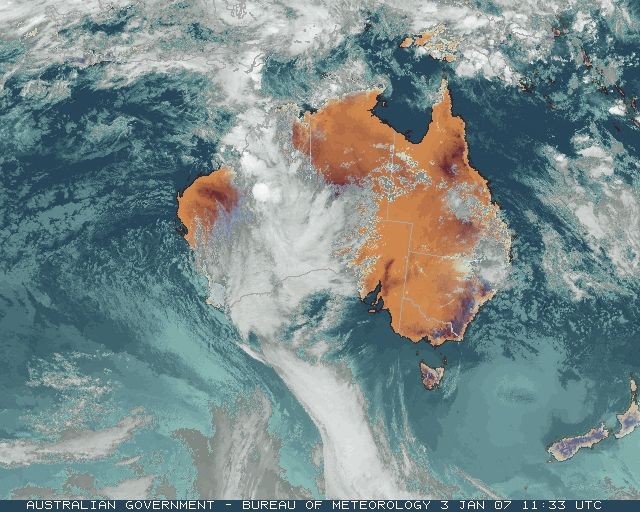
WA: Wintry outbreak brings record January cold. The north-south trough clearly visible through WA on the surface charts in The Day in Charts below fed vast amounts of moisture from TC Isobel into the state today, creating the extensive, deep cloudmass that dominates the satellite cloud images of Australia. At the same time, a tongue of very cold air for mid summer moved into the state from the southwest accompanied by a broad, deep upper low (see box below). Twenty-one centres, from the Gascoyne to the Central Wheatbelt and west to Perth, recorded their coldest-ever January day (see records). Perth Airport and Cunderdin, with around 60 years of climate history, both shaved half a degree off their previous records, while Dalwallinu (49 years) cut 1.7 and Wongan Hills (42 years) cut 2.6 off their previous lows.

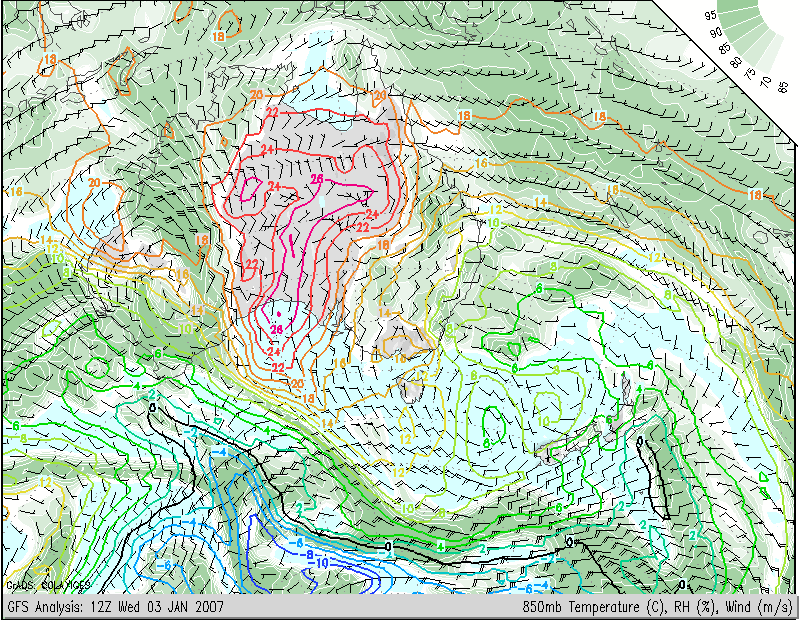
Some idea of the intensity of the WA cold airmass is given by the temperature readings at 850hPa (about 1.4km above sea level, and well away from surface heating effects) at 8pm WDT which indicated 28C at the Head of the Bight, but only 4C along the WA South West coast. Note the moisture streaming down through the eastern half of the state before curving around the base of the trough and returning northwards across SW WA, much envigorated by the colder air. 
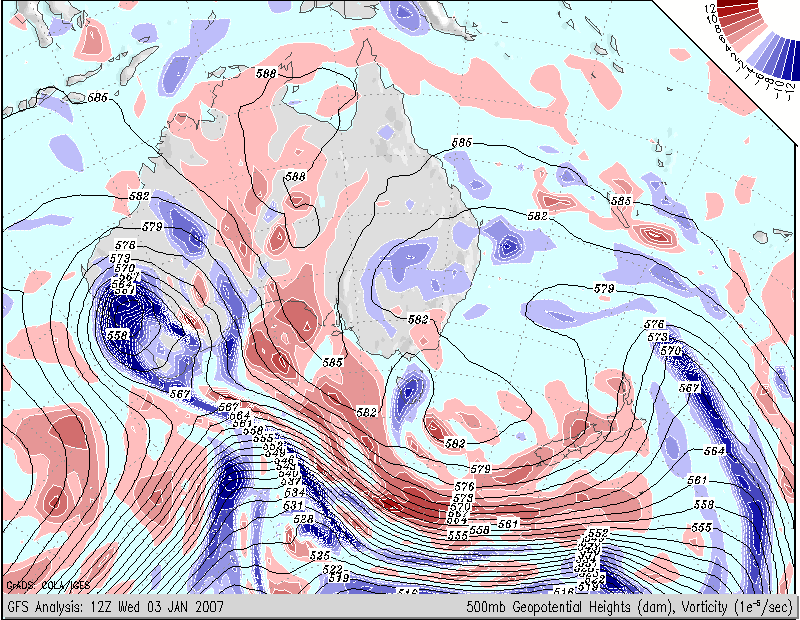
The upper air situation at 500hPa at the same time shows the deep upper low cutting off from its parent Southern Ocean trough and covering the southwestern third of the state. The upper low further enhanced uplift across the region, thickening cloud and bringing rain and record cold temperatures underneath it -- compare this chart to the satellite images, and the solar radiation and maximum temperature anomaly charts in The Day in Charts section below. COLA

WA, SA: Hot around the Bight. In stark contract to conditions farther west, maximum temperatures in SE WA and southern SA today were up to 20C above average, with several centres reporting 40C+ readings (see hottest). Yulara recorded its highest January minimum temperature, 30.5C, in 17 years of record.

VIC: Bushfires continue as firefighters prepare for worse. Firefighters from Canada, New Zealand and the Northern Territory are converging on VIC in advance of expected worsening fire weather during the next few days. The Canadians have specialist knowledge in forest firefighting and helicopter operations. Some 45 fires have been started by lightning across the state over the past 2 days, but most have been extinguished or are controlled. One at Boulder Creek, north of the Princes Highway between Orbost and Cann River, is now about 500 hectares in size. It caused smoke problems on the Highway today and grew rapidly in size this afternoon. The Great Divide fire complex continues to burn at low levels, and work is concentrated on back-burning and maintaining control lines, especially along its southern flank in the Erica, Thomson Catchment and Swifts Creek areas.

QLD: SE catchments at record low. Recent rain in SE QLD has bypassed the main catchments for Brisbane and the Gold and Sunshine Coasts. The combined capacity of the dams is currently 23.7%, the lowest on record. Falls of around 50mm in the past two days in parts of the SE have not fallen in catchment areas, with North Pine recording 18mm but Wivenhoe and Somerset virtually nothing. At least 50mm is needed to saturate the soil before run-off can begin. Details of some significant falls in the 24 hours to 9am in SE QLD (and across the border on the NSW North Coast) are in wettest below.

Bureau summaries issued today

AUS: Bureau's annual climate statement shows 2007 a year of contrasts. The Bureau of Meteorology's Annual Climate Statement, released today, shows Australia's annual mean temperature for 2006 was the eleventh warmest year since 1910 while the global mean temperature is expected to be the sixth warmest since 1861. Average maximum temperatures have been the highest on record since 1950 in Victoria, South Australia, Western Australia and in the Murray-Darling Basin. Rainfall was well below normal in the southeast and far southwest, but close to normal when averaged over the whole country. Full report.

TAS: A year of extremes. The Tasmanian state annual summary points up an extraordinarily varied year across the state, with some sites reporting their driest year for 100 years. Hobart, Launceston, Burnie and Devonport all experienced their lowest annual rainfall since records began. Tasmania also experienced some record hot and cold temperatures, several extremely windy days and a number of unseasonal bushfires, snow, frost and hail events throughout the year. Full report.

WA: Also a year of extremes. While average rainfall across WA during 2007 was the eighth highest since 1900, this masked extremes from north to south. In much of the north it was an exceptionally wet year, while the west coast and South West experienced well below average rain with parts of the coastal fringe, including Perth, having their driest year on record. Full reports for the state and Perth.

NT: A tale of two Territories. The Northern Territory in 2006 saw conditions much cooler and wetter than normal in the north but hotter and drier than normal in the south. Full report.

ACT: Records fell during 2006. Canberra experienced record sunshine and record daytime heat during 2006, while the year was the national capital's fifth driest on record. Full report.

NSW: A hot and very dry year. 2006 was the tenth consecutive year of above average statewide maximum and minimum temperatures. In the Murray-Darling Basin, it was the third driest year since 1900, while daytime maximum temperatures were the second highest on record. In Sydney, maximum temperatures were the third highest on record. Full reports for the state and Sydney.

SA: An extremely dry 2006. 2006 over South Australia was one of the driest since records began with many stations recording only about 50% of their annual totals. In all but the far west below average annual totals were recorded. The mean temperature for 2006 over South Australia was 20.3C, 0.8 above the 1961−90 mean making 2006 the third warmest year since 1910. Full report.

TAS: December weather summary - Bushfires and very dry despite a late soaking. The Tasmanian weather summary for December shows that, apart from a few patches in the southeast and central midlands, December followed the trend of the past eleven months, with drier than average conditions across the state. Conditions were such that many bushfires burned out of control for many weeks, burning out forest and causing damage to houses and other buildings. Despite the wet and cold end, most of the state was still slightly warmer than average during the day and generally much colder at night. Full report.

WA: December weather summaries - an average month. The monthly rainfall and average temperatures across WA in December were close to normal, though there were some notable local departures from average. Perth, however, was warmer than normal. Full reports for the state and for Perth.


Records set or equalled today

These records are based on data received as at 2302 EST on 20/08/2008. Help in interpreting these statistics and information on quality control is here.

District Site Today Previous monthly record Previous all time record
if equalled or broken
Comments
Reading Reading Date Years Reading Date Years
Highest daily rainfall

WA

SW & S Coast

009968

SHANNON

27.0

12.0

25/01/2006

11

1 n

Highest minimum temperature

NT

Alice Springs

015635

YULARA AERO

30.5

30.3

19/01/1987

17

1 Y

Lowest minimum temperature

WA

E Pilbara

004035

ROEBOURNE

16.6

18.6

04/01/1988

50

1

Lowest maximum temperature

WA

W Gascoyne

006022

GASCOYNE JUNCTION

26.0

26.1

26/01/1961

29

1 Y

WA

Murchison

007139

PAYNES FIND

17.3

19.0

30/01/2006

27

1 Y

WA

Central West

008025

CARNAMAH

20.5

21.2

28/01/1990

39

1 Y

WA

Central West

008039

DALWALLINU COMPARISON

16.2

17.9

22/01/1967

49

1 Y

WA

Central West

008138

WONGAN HILLS RES.STATION

17.3

19.9

15/01/1978

42

1 Y

WA

Lower West

009021

PERTH AIRPORT

20.1

20.6

22/01/2000

63

1 Y

WA

Lower West

009106

GOSNELLS CITY

20.3

20.5

20/01/1992

15

1 Y

WA

Lower West

009172

JANDAKOT AERO

20.0

20.9

09/01/1990

16

1 Y

WA

Lower West

009178

GINGIN AERO

20.1

20.5

12/01/2006

11

1 Y

WA

Lower West

009193

ROTTNEST ISLAND

19.4

20.6

24/01/2001

15

Y

WA

Lower West

009194

MEDINA RESEARCH CENTRE

20.2

20.2

25/01/1989

23

1 Y Equal to record.

WA

Lower West

009215

SWANBOURNE

20.4

22.0

12/01/2006

13

1 Y

WA

Lower West

009225

PERTH METRO

19.7

21.6

12/01/2006

14

1 Y

WA

Lower West

009240

BICKLEY

17.0

17.0

22/01/2000

14

Y Equal to record.

WA

Cent Wheatbelt

010035

CUNDERDIN

17.9

18.5

22/01/2000

57

1 Y

WA

Cent Wheatbelt

010058

GOOMALLING

18.0

20.0

27/01/1968

29

1 Y

WA

Cent Wheatbelt

010111

NORTHAM

18.2

19.2

22/01/2000

42

1 Y

WA

Cent Wheatbelt

010286

CUNDERDIN AIRFIELD

18.1

20.3

05/01/1999

11

1 Y

WA

Cent Wheatbelt

010311

YORK

18.0

18.7

22/01/2000

11

1 Y

WA

Gt Southern

010614

NARROGIN

15.8

16.6

05/01/1999

41

1 Y

WA

Gt Southern

010647

WAGIN

16.4

17.3

13/01/2006

33

1 Y

QLD

Darling Downs E

041525

WARWICK

19.6

22.0

03/01/1996

11

1 Y

QLD

Darling Downs E

041529

TOOWOOMBA AIRPORT

18.6

19.1

01/01/1999

11

1 Y

NSW

N Tablelands W

056011

GLEN INNES POST OFFICE

15.1

15.6

31/01/1971

44

1 Y

NSW

N Tablelands W

056243

GLEN INNES AIRPORT AWS

16.1

17.0

01/01/1999

11

1 Y

NSW

North Coast

058130

GRAFTON OLYMPIC POOL

20.4

20.5

23/01/1996

40

1 Y

Highest daily average wind speed - anemometer above 3m (km/h)

QLD

Central West

036031

LONGREACH AERO

28.2

26.8

20/01/1997

11

1 Y


The day in charts
Surface charts Satellite images Rain & temperatures
4am EST Rainfall -- 24 hours to 9am
Available about 6am EST Available about 4am EST Available about 2pm EST
Week to 9am | SE AUS detail
10am EST Minimum temperature +/- normal
Available about noon EST Available about 10am EST Available about 2pm EST next day
Actual temperatures
4pm EST Maximum temperature +/- normal
Available about 6pm EST Available about 4pm EST Available about 2pm EST next day
Actual temperatures
10pm EST Solar Radiation
Available about midnight EST Available about 10pm EST Available about 2am EST next day

Summary of observations

For notes on how to interpret the data and quality control issues, see Daily Weather Summary Help.
**S** and **W** precede data flagged by the Bureau as suspicious or wrong
Data is as received at 23:52EST, 14/05/2012.

Major centres
Max
° C
+/- norm
° C
Min
° C
+/- norm
° C
Grass Min
° C
Rain to 9am mm Evaporation to 9am mm Sunshine hours Wind Run to 9am km (24-hour average km/h) Maximum Gust km/h / hour of occurrence
GERALDTON AIRPORT 24.1 -7.5 16.3 -2.0 16.0 1.0 9.6 -- 564 (23.5) 71/20
PERTH AIRPORT 20.1 -11.5 12.3 -4.6 13.2 14.8 5.4 1.1 421 (17.5) 48/21
ALBANY AIRPORT 18.1 -6.6 11.9 -1.8 12.0 5.8 3.6 1.2 259 (10.8) 39/17
BUNBURY 23.0 -6.4 11.8 -3.3 -- 27.0 -- -- 203 ( 8.5) 44/10
MANDURAH 20.6 -- 12.7 -- -- 11.8 -- -- 319 (13.3) 50/18
DARWIN AIRPORT 33.5 +1.7 25.7 +0.9 24.9 7.4 5.4 7.4 289 (12.0) 37/14
ALICE SPRINGS AIRPORT 39.1 +2.7 28.0 +6.6 25.4 0.0 -- 5.8 361 (15.0) 46/16
WHYALLA AERO 35.7 +5.8 18.5 +1.1 -- 0.0 12.0 -- 252 (10.5) 31/11
ADELAIDE (KENT TOWN) 35.2 +6.1 24.3 +7.3 20.9 0.0 9.8 12.7 357 (14.9) 45/15
MOUNT GAMBIER AERO 34.4 +9.2 18.0 +6.9 14.1 0.0 11.8 13.6 475 (19.8) 58/13
MOUNT ISA AERO 41.4 +5.1 23.4 -0.4 19.8 1.2 12.2 10.4 348 (14.5) 59/15
CAIRNS AERO 33.1 +1.7 24.7 +1.0 23.5 0.8 9.6 8.2 479 (20.0) 41/15
TOWNSVILLE AERO 31.3 0.0 24.7 +0.5 23.1 0.8 8.8 10.3 548 (22.8) 41/23
MACKAY M.O 29.2 -0.9 24.0 +0.5 -- 2.2 -- 10.6 401 (16.7) 39/00
ROCKHAMPTON AERO 29.5 -2.4 20.9 -1.2 21.0 7.6 8.4 -- -- --
BUNDABERG AERO 28.0 -2.1 20.7 -0.7 -- 0.4 9.4 -- -- --
NAMBOUR DPI 24.7 -4.6 17.2 -2.2 -- 17.0 4.8 -- 111 ( 4.6) 30/12
COOLANGATTA 25.1 -3.0 18.9 -2.1 -- 11.2 -- -- 352 (14.7) 44/09
BRISBANE AERO 25.1 -3.9 19.0 -2.1 18.7 14.4 7.2 0.0 403 (16.8) 41/04
TOOWOOMBA AIRPORT 18.6 -9.5 15.3 -2.2 -- 0.0 -- -- 702 (29.3) 63/13
GUNNEDAH RESOURCE CENTRE 22.7 -9.2 18.1 -0.7 14.1 0.0 6.2 -- 262 (10.9) --
COFFS HARBOUR MO 23.1 -3.8 17.9 -1.5 17.4 3.4 5.4 0.0 378 (15.8) 39/01
PORT MACQUARIE AIRPORT AWS 24.3 -3.1 14.4 -3.7 -- 0.0 -- -- -- --
WILLIAMTOWN RAAF 24.3 -3.6 18.0 0.0 15.9 0.4 7.2 3.0 453 (18.9) 48/13
GOSFORD (NARARA RESEARCH STATION) AWS 24.4 -3.1 16.8 +0.1 18.4 7.8 -- -- 128 ( 5.3) 28/09
ORANGE AGRICULTURAL INSTITUTE 23.1 -3.4 13.0 -0.2 10.5 19.8 29.0 12.5 -- --
DUBBO AIRPORT AWS 25.9 -7.2 15.9 -2.2 -- 4.0 -- -- -- --
SYDNEY AIRPORT AMO 24.9 -1.5 17.7 -1.0 14.2 2.2 6.2 6.8 639 (26.6) 45/14
RICHMOND RAAF 25.8 -4.0 16.8 -0.6 -- 1.6 -- -- 254 (10.6) 41/15
BELLAMBI AWS 23.7 -1.1 18.5 -0.4 -- 2.6 -- -- 488 (20.3) 34/09
CANBERRA AIRPORT 24.8 -3.2 13.5 +0.3 11.0 0.0 5.2 11.0 497 (20.7) 46/20
WAGGA WAGGA AMO 31.3 -0.3 16.5 +0.3 14.3 0.0 8.6 13.6 645 (26.9) 54/10
ALBURY AIRPORT AWS 33.2 +1.0 15.0 -1.6 -- 2.2 -- -- 191 ( 8.0) 39/20
MILDURA AIRPORT 32.5 +0.3 19.1 +2.5 17.4 0.0 10.6 11.5 409 (17.0) 48/15
TATURA INST SUSTAINABLE AG 32.2 +2.7 19.0 +4.9 -- 0.0 8.4 -- 365 (15.2) 44/14
BENDIGO AIRPORT 31.9 +2.4 19.0 +5.1 -- 0.0 -- -- 403 (16.8) 45/12
MELBOURNE REGIONAL OFFICE 32.8 +6.9 19.8 +5.5 17.0 0.0 4.8 -- 119 ( 5.0) 30/17
GEELONG AIRPORT 32.4 +7.8 15.5 +2.4 -- 0.0 -- -- 293 (12.2) 46/15
BALLARAT AERODROME 31.3 +6.3 17.9 +7.1 -- 0.2 -- -- 491 (20.5) 46/10
LAUNCESTON (TI TREE BEND) 27.1 +2.9 14.3 +2.2 -- 0.0 -- -- 253 (10.5) 35/13
HOBART AIRPORT 26.5 +4.0 13.2 +1.2 8.8 0.0 4.2 11.8 533 (22.2) 41/18
Max
° C
+/- norm
° C
Min
° C
+/- norm
° C
Grass Min
° C
Rain to 9am mm Evaporation to 9am mm Sunshine hours Wind Run to 9am km Maximum Gust km/h / hour of occurrence
Hottest
Highest maximum temperature>Greatest variation above normal maximum Highest minimum temperatureGreatest variation above normal minimum

45.4 EUCLA Eucla WA
44.6 NULLARBOR W Agricultural SA
43.1 JERVOIS N Plateau NT
42.9 KULGERA N Plateau NT
42.7 FORREST Eucla WA
42.7 URANDANGI Northwest QLD

+19.6 : 45.4 EUCLA Eucla WA
+16.7 : 44.6 NULLARBOR W Agricultural SA
+14.0 : 42.5 CEDUNA AMO W Agricultural SA
+13.8 : 39.5 ELLISTON W Agricultural SA
+11.8 : 33.5 PORTLAND (CASHMORE AIRPORT) W Coast VIC
+11.8 : 39.2 COULTA (COLES POINT) W Agricultural SA

30.5 YULARA AERO N Plateau NT
29.5 TENNANT CREEK AIRPORT N Plateau NT
29.0 WAVE HILL N Rivers NT
28.4 KIDMAN SPRINGS N Rivers NT
28.4 BRUNETTE DOWNS N Plateau NT

+10.5 : 22.0 NARACOORTE AERODROME Lower SE SA
+9.2 : 20.6 COONAWARRA Lower SE SA
+8.3 : 24.7 EDINBURGH RAAF Adelaide/Lofty SA
+7.8 : 20.9 KEITH Mallee/Upper SE SA
+7.7 : 30.5 YULARA AERO N Plateau NT

Coldest
Lowest maximum temperatureGreatest variation below normal maximum Lowest minimum temperatureGreatest variation below normal minimum

15.1 GLEN INNES POST OFFICE N Tablelands W NSW
15.1 JACUP Cent Wheatbelt WA
15.2 GUYRA HOSPITAL N Tablelands W NSW
15.5 RAVENSTHORPE Cent Wheatbelt WA
15.5 MOUNT BARKER Lower West WA

-19.9 : 17.3 PAYNES FIND E Gascoyne WA
-19.0 : 16.2 DALWALLINU COMPARISON Central West WA
-18.7 : 16.3 DALWALLINU Central West WA
-18.3 : 16.2 BENCUBBIN Cent Wheatbelt WA
-17.7 : 19.2 MORAWA AIRPORT Central West WA

3.5 THREDBO AWS Snowy Mtns NSW
4.5 THREDBO VILLAGE Snowy Mtns NSW
6.0 MOUNT GININI AWS Goulburn/Monaro NSW
6.2 CHARLOTTE PASS (KOSCIUSKO CHALET) Snowy Mtns NSW
6.6 MOUNT WELLINGTON Southeast TAS

-9.6 : 16.6 ROEBOURNE E Pilbara WA
**S** -8.4 : 16.1 EMU CREEK STATION W Gascoyne WA
-6.6 : 18.5 BEDOURIE POLICE STATION Channel Country QLD
-6.5 : 11.5 SWANBOURNE Lower West WA
-6.1 : 20.0 WITTENOOM W Pilbara WA

Wettest
Sunniest & dullest
Windiest
Highest gusts
Todays highest rainfall totals for the 24 hours to 9am. It includes the top 5 totals nationally followed by all reported falls of 50mm or more.
Highest and lowest recordings of hours of sunshine for the 24 hours to midnight.
Highest wind run totals in kilometres for the 24 hours to 9am (average speed in brackets). All reported runs > =25km/h are shown.
Highest wind gusts in km/h for the 24 hours to midnight followed by the hour in which it occurred. All stations with gusts > 89km/h are shown.
132.8 BEAGLE BAY W Kimberley WA
111.0 COPMANHURST (STOCKYARD CREEK) North Coast NSW
108.0 HORSESHOE LAGOON Maranoa QLD
78.0 ULMARRA (NEWSAGENCY) North Coast NSW
77.8 OLDFIELD Lower West WA

WESTERN AUSTRALIA
W Kimberley
132.8 BEAGLE BAY
77.2 PORT SMITH
77.0 BIDYADANGA
62.0 ANNA PLAINS
52.6 COUNTRY DOWNS
52.1 NITA DOWNS
52.0 WEST ROEBUCK
50.2 KIRBY GARDENS
50.0 ROEBUCK PLAINS
E Pilbara
74.8 MALLINA
72.0 MUNDABULLANGANA
56.1 WHIM CREEK
W Pilbara
61.0 KARRATHA STATION
Lower West
77.8 OLDFIELD
Goldfields
60.0 YERILLA
53.0 WOOLIBAR

QUEENSLAND
Central Highlands
74.0 MANTUAN DOWNS
56.0 YANDABURRA
Brisbane/SE Coast
72.0 BRIBIE ISLAND ALERT
66.0 SPRINGBROOK LOWER ALERT
55.0 WUNBURRA
53.0 SPRINGBROOK ROAD
51.6 UPPER MUDGEERABA WATER
Darling Downs W
66.0 BELAH PARK
58.0 THALLON POST OFFICE
Maranoa
108.0 HORSESHOE LAGOON

NEW SOUTH WALES
North Coast
111.0 COPMANHURST (STOCKYARD CREEK)
78.0 ULMARRA (NEWSAGENCY)
72.2 LAWRENCE ROAD (PRINGLES WAY)
68.6 GRAFTON RESEARCH STN
67.6 SEELANDS (BREAM PLACE)
60.4 GRAFTON AIRPORT
60.2 LAWRENCE POST OFFICE
60.0 WOOLI (SANDSTONE HILL)
59.0 BALLINA AIRPORT AWS
57.4 PILLAR VALLEY
55.4 WOOMBAH (ADAMS STREET)
52.2 ALSTONVILLE TROPICAL FRUIT RESEARCH STAT
52.0 BALLINA (CROWLEY VILLAGE)
51.8 GRAFTON OLYMPIC POOL

13.6 MOUNT GAMBIER AERO Lower SE SA
13.6 WAGGA WAGGA AMO SW Slopes S NSW
13.4 NURIOOTPA VITICULTURAL Adelaide/Lofty SA
13.3 MELBOURNE AIRPORT E Central VIC
13.1 WOOMERA AERODROME NW Pastoral SA

.....

0.0 BROOME AIRPORT W Kimberley WA
0.0 BRISBANE AERO Brisbane/SE Coast QLD
0.0 WARWICK Darling Downs E QLD
0.0 MOREE AERO NW Plains E NSW
0.0 COFFS HARBOUR MO MidNorth Coast N NSW

1331 (55.5) CAPE GRIM BAPS N Coast TAS
1263 (52.6) HOGAN ISLAND Islands ISL
1082 (45.1) WILSONS PROMONTORY LIGHTHOUSE W Gippsland VIC
1013 (42.2) KING ISLAND AIRPORT King Island TAS
994 (41.4) TASMAN ISLAND Southeast TAS
889 (37.0) SMITHTON AERODROME N Coast TAS
807 (33.6) LOW HEAD N Coast TAS
789 (32.9) HAMILTON ISLAND AIRPORT Central Coast E QLD
784 (32.7) FLINDERS ISLAND AIRPORT Flinders Is/Bass St TAS
766 (31.9) CARNARVON AIRPORT W Gascoyne WA
740 (30.8) CAPE MORETON LIGHTHOUSE Brisbane/SE Coast QLD
715 (29.8) WILLIS ISLAND Islands ISL
702 (29.3) TOOWOOMBA AIRPORT Darling Downs E QLD
693 (28.9) LADY ELLIOT ISLAND Wide Bay/Burnett QLD
693 (28.9) GREEN CAPE AWS South Coast NSW
689 (28.7) PORT HEDLAND AIRPORT E Pilbara WA
679 (28.3) LOW ISLES LIGHTHOUSE N Coast--Barron QLD
678 (28.3) MOUNT READ W Coast TAS
677 (28.2) LONGREACH AERO Central West QLD
666 (27.8) MURRURUNDI GAP AWS Hunter Valley NSW
663 (27.6) LEARMONTH AIRPORT W Pilbara WA
662 (27.6) DOUBLE ISLAND POINT LIGHTHOUSE Brisbane/SE Coast QLD
659 (27.5) DALBY AIRPORT Darling Downs E QLD
658 (27.4) ALVA BEACH Central Coast E QLD
654 (27.3) DEVONPORT AIRPORT N Coast TAS
653 (27.2) FORREST Eucla WA
645 (26.9) WAGGA WAGGA AMO SW Slopes S NSW
643 (26.8) MOUNT WELLINGTON Southeast TAS
639 (26.6) SYDNEY AIRPORT AMO Sydney--east NSW
629 (26.2) WYNYARD AIRPORT N Coast TAS
628 (26.2) SWAN ISLAND E Coast TAS
626 (26.1) CAPE OTWAY LIGHTHOUSE W Coast VIC
616 (25.7) CAPE BRUNY (CAPE BRUNY) Southeast TAS
609 (25.4) LAVERTON AERO Goldfields WA
609 (25.4) GLADSTONE RADAR Wide Bay/Burnett QLD
602 (25.1) BLACKALL AIRPORT Central West QLD
602 (25.1) CABRAMURRA SMHEA AWS SW Slopes S NSW
601 (25.0) COLAC (MT GELLIBRAND) W Coast VIC
600 (25.0) CAPE FLATTERY N Coast--Barron QLD
83/10 CAPE GRIM BAPS N Coast TAS
81/21 TASMAN ISLAND Southeast TAS
81/21 VARANUS ISLAND Islands ISL
78/03 HOGAN ISLAND Islands ISL
76/17 THEVENARD ISLAND W Pilbara WA
76/20 BARROW ISLAND AIRPORT W Pilbara WA
76/18 WINTON AIRPORT Northwest QLD
76/07 CAPE MORETON LIGHTHOUSE Brisbane/SE Coast QLD

Downpours High AWS wind reports
High rainfall for periods of 6 hours or less from AWS and synoptic reports. Storm force gusts (>89km/h) and 10-minute mean gales (>62km/h) reported by AWSs. Wind direction and mean windspeed are shown in brackets.
WESTERN AUSTRALIA
W Kimberley
BROOME AIRPORT
11.0mm in 1 hr to 05:30 11.0mm/h
15.4mm in 1 hr to 06:00 15.4mm/h
23.0mm in 3 hr to 06:00 7.7mm/h
10.0mm in 1 hr to 11:30 10.0mm/h
BIDYADANGA
40.0mm in 6 hr to 15:00 6.7mm/h
DERBY AERO
11.6mm in 1 hr to 07:00 11.6mm/h
CURTIN AERO
11.8mm in 55 min to 07:55 12.9mm/h
18.0mm in 3 hr to 09:00 6.0mm/h
WEST ROEBUCK
10.2mm in 1 hr to 11:30 10.2mm/h
E Pilbara
MANDORA
141.0mm in 6 hr to 15:00 23.5mm/h
PORT HEDLAND AIRPORT
13.4mm in 30 min to 02:30 26.8mm/h
15.2mm in 1 hr to 02:30 15.2mm/h
14.0mm in 1 hr to 03:00 14.0mm/h
ROEBOURNE AERO
21.8mm in 45 min to 03:00 29.1mm/h
22.0mm in 1 hr to 03:00 22.0mm/h
23.0mm in 3 hr to 03:00 7.7mm/h
12.6mm in 1 hr to 04:00 12.6mm/h
E Gascoyne
NEWMAN AERO
15.0mm in 3 hr to 12:00 5.0mm/h
Goldfields
LAVERTON AERO
11.2mm in 1 hr to 14:00 11.2mm/h
19.0mm in 3 hr to 15:00 6.3mm/h
11.4mm in 58 min to 16:00 11.8mm/h
11.6mm in 1 hr to 16:00 11.6mm/h
26.0mm in 3 hr to 18:00 8.7mm/h
Interior
TELFER AERO
15.0mm in 1 hr to 18:00 15.0mm/h
25.0mm in 3 hr to 18:00 8.3mm/h
10.4mm in 44 min to 18:44 14.2mm/h
20.0mm in 3 hr to 21:00 6.7mm/h
QUEENSLAND
Central Coast E
ST LAWRENCE POST OFFICE
989.0mm in 6 hr to 03:00 164.8mm/h
Central West
BLACKALL AIRPORT
9.4mm in 14 min to 19:44 40.3mm/h
14.8mm in 1 hr to 20:00 14.8mm/h
15.0mm in 3 hr to 21:00 5.0mm/h
Wide Bay/Burnett
ROCKHAMPTON AERO
300.0mm in 9 hr to 06:00 33.3mm/h
400.0mm in 9 hr to 09:00 44.4mm/h
Brisbane/SE Coast
AMBERLEY AMO
14.4mm in 30 min to 07:30 28.8mm/h
20.2mm in 1 hr to 07:30 20.2mm/h
10.8mm in 30 min to 08:00 21.6mm/h
25.2mm in 1 hr to 08:00 25.2mm/h
16.4mm in 1 hr to 08:30 16.4mm/h
12.0mm in 1 hr to 09:00 12.0mm/h
44.0mm in 3 hr to 09:00 14.7mm/h
NAMBOUR DPI
18.2mm in 1 hr to 11:00 18.2mm/h
21.0mm in 3 hr to 12:00 7.0mm/h
BEERBURRUM FOREST STATION
14.6mm in 1 hr to 09:00 14.6mm/h
16.0mm in 3 hr to 09:00 5.3mm/h
NEW SOUTH WALES
NW Plains E
MOREE AERO
18.0mm in 30 min to 06:00 36.0mm/h
18.0mm in 1 hr to 06:00 18.0mm/h
18.0mm in 1 hr to 06:30 18.0mm/h
North Coast
GRAFTON RESEARCH STN
10.0mm in 30 min to 05:30 20.0mm/h
16.2mm in 1 hr to 05:30 16.2mm/h
19.6mm in 1 hr to 06:00 19.6mm/h
32.0mm in 3 hr to 06:00 10.7mm/h
15.0mm in 1 hr to 06:30 15.0mm/h
15.0mm in 3 hr to 09:00 5.0mm/h
16.0mm in 3 hr to 12:00 5.3mm/h
GRAFTON AIRPORT
19.0mm in 3 hr to 03:00 6.3mm/h
11.2mm in 1 hr to 04:00 11.2mm/h
18.0mm in 3 hr to 06:00 6.0mm/h
19.0mm in 3 hr to 09:00 6.3mm/h
BALLINA AIRPORT AWS
17.6mm in 1 hr to 01:00 17.6mm/h
17.4mm in 1 hr to 02:00 17.4mm/h
11.0mm in 1 hr to 03:00 11.0mm/h
46.0mm in 3 hr to 03:00 15.3mm/h

WESTERN AUSTRALIA
W Pilbara
BARROW ISLAND AIRPORT : 72(230/ 63 ) at 21:30
TASMANIA
N Coast
CAPE GRIM BAPS : 78(100/ 63 ) at 12:00
Southeast
TASMAN ISLAND : 80( 10/ 69 ) at 20:30