|
For notes on how to interpret
the data and quality control issues, see Daily Weather Summary Help.
**S** and **W** precede data flagged by the Bureau as suspicious or wrong
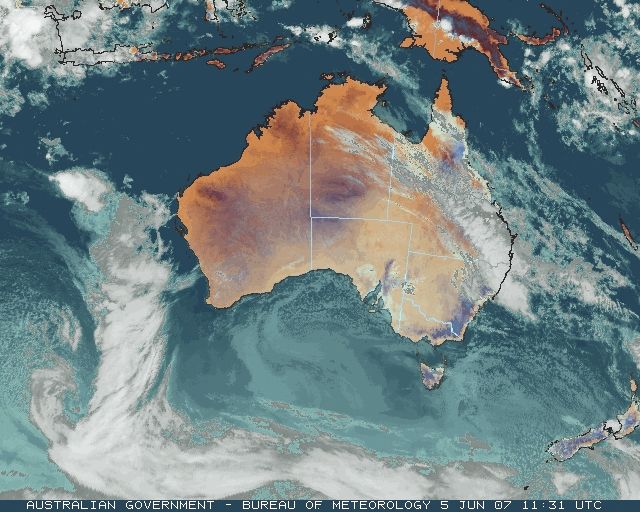
Data is as received at 00:42EST, 15/05/2012.
|
|
| |
Max
°
C |
+/- norm
°
C |
Min
°
C |
+/- norm
°
C |
Grass Min
°
C |
Rain to 9am mm |
Evaporation to 9am mm |
Sunshine hours |
Wind Run to 9am km (24-hour average km/h) |
Maximum Gust km/h / hour of occurrence |
| GERALDTON AIRPORT |
25.8 |
+4.9 |
12.7 |
+1.7 |
9.3 |
0.0 |
5.8 |
-- |
434 (18.1) |
45/07 |
| PERTH AIRPORT |
20.2 |
+1.3 |
10.4 |
+1.4 |
6.4 |
0.0 |
3.2 |
8.8 |
568 (23.7) |
63/10 |
| ALBANY AIRPORT |
17.3 |
+0.7 |
7.9 |
-0.2 |
6.1 |
4.0 |
2.2 |
8.9 |
455 (19.0) |
46/13 |
| BUNBURY |
19.8 |
+1.4 |
7.8 |
-0.3 |
-- |
0.0 |
-- |
-- |
332 (13.8) |
44/23 |
| MANDURAH |
19.5 |
-- |
11.6 |
-- |
-- |
0.0 |
-- |
-- |
353 (14.7) |
50/23 |
| DARWIN AIRPORT |
33.1 |
+2.5 |
22.0 |
+2.1 |
21.3 |
0.0 |
8.0 |
10.8 |
426 (17.8) |
41/09 |
| ALICE SPRINGS AIRPORT |
17.2 |
-2.6 |
6.2 |
+1.1 |
3.7 |
0.0 |
4.6 |
10.4 |
385 (16.0) |
43/11 |
| WHYALLA AERO |
14.3 |
-3.0 |
6.4 |
+0.3 |
-- |
4.0 |
4.0 |
-- |
-- |
28/13 |
| ADELAIDE (KENT TOWN) |
14.5 |
-1.6 |
5.8 |
-2.3 |
5.8 |
2.0 |
1.0 |
5.4 |
149 ( 6.2) |
28/12 |
| MOUNT GAMBIER AERO |
14.6 |
+0.8 |
6.8 |
+1.0 |
4.4 |
0.2 |
0.4 |
5.5 |
296 (12.3) |
32/15 |
| MOUNT ISA AERO |
19.1 |
-5.8 |
13.9 |
+3.9 |
12.4 |
0.6 |
7.2 |
1.0 |
541 (22.5) |
41/02 |
| CAIRNS AERO |
27.6 |
+1.6 |
22.3 |
+4.5 |
20.8 |
1.4 |
6.2 |
2.5 |
336 (14.0) |
37/14 |
| TOWNSVILLE AERO |
28.9 |
+3.3 |
22.2 |
+7.6 |
20.5 |
0.0 |
2.2 |
3.4 |
289 (12.0) |
32/13 |
| MACKAY M.O |
23.8 |
+1.9 |
21.0 |
+7.0 |
-- |
8.4 |
-- |
0.6 |
359 (15.0) |
35/10 |
| ROCKHAMPTON AERO |
24.6 |
+1.1 |
18.7 |
+7.8 |
18.6 |
29.2 |
7.0 |
-- |
277 (11.5) |
28/10 |
| BUNDABERG AERO |
22.1 |
-0.5 |
18.8 |
+7.2 |
-- |
1.0 |
-- |
-- |
270 (11.3) |
28/12 |
| NAMBOUR DPI |
21.0 |
-0.6 |
15.4 |
+6.1 |
-- |
0.0 |
3.1 |
-- |
36 ( 1.5) |
24/22 |
| COOLANGATTA |
23.2 |
+2.1 |
16.7 |
+5.2 |
-- |
0.2 |
-- |
-- |
235 ( 9.8) |
30/17 |
| BRISBANE AERO |
21.9 |
+0.6 |
15.9 |
+5.4 |
-- |
0.0 |
2.4 |
0.2 |
266 (11.1) |
34/16 |
| TOOWOOMBA AIRPORT |
16.4 |
-0.6 |
13.0 |
+5.5 |
-- |
0.0 |
-- |
-- |
401 (16.7) |
39/22 |
| GUNNEDAH RESOURCE CENTRE |
17.0 |
+0.2 |
4.1 |
-2.0 |
0.5 |
0.2 |
0.8 |
-- |
163 ( 6.8) |
-- |
| COFFS HARBOUR MO |
20.7 |
+1.3 |
9.8 |
+0.7 |
6.6 |
0.0 |
2.8 |
6.2 |
287 (12.0) |
30/11 |
| PORT MACQUARIE AIRPORT AWS |
20.0 |
+0.5 |
7.4 |
-0.6 |
-- |
0.0 |
-- |
-- |
-- |
-- |
| WILLIAMTOWN RAAF |
18.4 |
+0.8 |
5.7 |
-2.2 |
2.9 |
0.0 |
2.6 |
5.1 |
257 (10.7) |
28/14 |
| GOSFORD (NARARA RESEARCH STATION) AWS |
17.7 |
-0.2 |
6.5 |
0.0 |
-- |
0.0 |
-- |
-- |
56 ( 2.3) |
21/11 |
| ORANGE AGRICULTURAL INSTITUTE |
11.4 |
+0.9 |
-1.5 |
-4.1 |
-4.0 |
0.4 |
1.6 |
6.0 |
-- |
-- |
| DUBBO AIRPORT AWS |
16.0 |
-0.4 |
1.7 |
-2.9 |
-- |
0.0 |
-- |
-- |
-- |
-- |
| SYDNEY AIRPORT AMO |
16.6 |
-1.0 |
8.0 |
-0.5 |
4.6 |
0.0 |
2.4 |
5.5 |
379 (15.8) |
41/14 |
| RICHMOND RAAF |
16.2 |
-1.8 |
1.7 |
-3.2 |
-- |
0.2 |
-- |
-- |
46 ( 1.9) |
21/13 |
| BELLAMBI AWS |
16.6 |
-1.1 |
9.9 |
-1.1 |
-- |
0.0 |
-- |
-- |
319 (13.3) |
37/13 |
| CANBERRA AIRPORT |
13.7 |
+1.5 |
-1.9 |
-2.9 |
-5.0 |
0.2 |
1.2 |
8.5 |
60 ( 2.5) |
24/11 |
| WAGGA WAGGA AMO |
13.7 |
-0.1 |
2.8 |
-0.9 |
2.2 |
0.2 |
1.4 |
6.1 |
136 ( 5.7) |
21/10 |
| ALBURY AIRPORT AWS |
14.7 |
+0.5 |
1.6 |
-2.3 |
-- |
0.2 |
-- |
-- |
65 ( 2.7) |
17/13 |
| MILDURA AIRPORT |
13.2 |
-2.8 |
6.3 |
+1.1 |
2.7 |
0.0 |
0.8 |
3.1 |
292 (12.2) |
26/06 |
| TATURA INST SUSTAINABLE AG |
13.4 |
-0.6 |
0.4 |
-3.3 |
-- |
0.0 |
-- |
-- |
129 ( 5.4) |
17/08 |
| BENDIGO AIRPORT |
13.7 |
+0.5 |
3.5 |
-0.1 |
-- |
1.6 |
-- |
-- |
222 ( 9.3) |
�
30/10 |
| MELBOURNE REGIONAL OFFICE |
14.5 |
+0.5 |
5.3 |
-1.6 |
3.4 |
0.0 |
0.8 |
-- |
59 ( 2.5) |
18/13 |
| GEELONG AIRPORT |
14.5 |
-0.1 |
8.3 |
+2.0 |
-- |
0.2 |
-- |
-- |
283 (11.8) |
30/14 |
| BALLARAT AERODROME |
11.8 |
+1.0 |
4.2 |
+0.2 |
-- |
6.4 |
-- |
-- |
343 (14.3) |
30/11 |
| LAUNCESTON (TI TREE BEND) |
14.2 |
+1.1 |
0.2 |
-2.7 |
-- |
0.0 |
-- |
-- |
125 ( 5.2) |
13/14 |
| HOBART AIRPORT |
15.8 |
+2.9 |
5.1 |
+0.5 |
2.4 |
0.0 |
1.6 |
8.3 |
-- |
39/14 |
| |
Max
°
C |
+/- norm
°
C |
Min
°
C |
+/- norm
°
C |
Grass Min
°
C |
Rain to 9am mm |
Evaporation to 9am mm |
Sunshine hours |
Wind Run to 9am km |
Maximum Gust km/h / hour of occurrence |
|
| Hottest |
| Highest maximum temperature> | Greatest variation above normal maximum |
Highest minimum temperature | Greatest variation above normal minimum |
36.5 PORT KEATS AERO N Rivers NT
34.3 MIDDLE POINT AWS N Rivers NT
33.9 WEIPA AERO N Peninsula QLD
33.6 OENPELLI N Rivers NT
33.3 KOWANYAMA AIRPORT Gulf Country QLD
33.3 JABIRU AIRPORT N Rivers NT
|
+6.2 : 29.5 CARNARVON AIRPORT W Gascoyne WA
+6.1 : 28.9 KALBARRI Central West WA
+5.3 : 27.0 LOGAN CITY WATER TREATMENT Brisbane/SE Coast QLD
+4.9 : 25.8 GERALDTON AIRPORT Central West WA
+4.8 : 33.0 GEORGETOWN POST OFFICE Upper Carpentaria QLD
|
26.1 COCONUT ISLAND N Peninsula QLD
26.0 HORN ISLAND N Peninsula QLD
25.5 WILLIS ISLAND Islands ISL
25.3 COCOS ISLAND AIRPORT Islands ISL
25.2 OENPELLI N Rivers NT
|
+10.5 : 21.1 COLLINSVILLE POST OFFICE Central Coast E QLD
+10.4 : 17.5 ROLLESTON METEOR ST Central Highlands QLD
+10.3 : 18.5 LONGREACH AERO Central West QLD
+10.3 : 17.8 GAYNDAH POST OFFICE Wide Bay/Burnett QLD
+10.3 : 17.4 SPRINGSURE DAME ST Central Highlands QLD
|
| Coldest |
| Lowest maximum temperature | Greatest variation below normal maximum |
Lowest minimum temperature | Greatest variation below normal minimum |
0.3 MT HOTHAM Upper NE VIC
0.5 THREDBO AWS Snowy Mtns NSW
2.6 FALLS CREEK Upper NE VIC
3.0 MOUNT BULLER Upper NE VIC
4.0 GRAMPIANS (MOUNT WILLIAM) Wimmera S VIC
4.0 MOUNT GININI AWS Goulburn/Monaro NSW
|
-5.8 : 19.1 MOUNT ISA AERO Gulf Country QLD
-5.6 : 12.0 WHITE CLIFFS POST OFFICE Far Northwest NSW
-5.5 : 11.8 MENINDEE POST OFFICE Lower Darling NSW
-5.2 : 11.6 ARKAROOLA NE Pastoral SA
-5.1 : 11.1 BROKEN HILL AIRPORT AWS Lower Darling NSW
|
-6.0 CHARLOTTE PASS (KOSCIUSKO CHALET) Snowy Mtns NSW
-5.4 THREDBO AWS Snowy Mtns NSW
-5.0 PERISHER VALLEY SKI CENTRE Snowy Mtns NSW
-4.4 MT HOTHAM Upper NE VIC
-3.9 ORANGE AIRPORT AWS C Tablelands S NSW
|
-7.4 : -0.5 EYRE Eucla WA
-6.9 : -0.5 CEDUNA AMO W Agricultural SA
-5.7 : -0.5 PARKES (MACARTHUR STREET) CW Slopes S NSW
-5.7 : 0.3 KEITH Mallee/Upper SE SA
-5.7 : 3.4 WINDY HARBOUR Lower West WA
|
|
Sunniest &
dullest |
Windiest |
Highest gusts |
Todays highest rainfall totals for the 24 hours to 9am. It
includes the top 5 totals nationally followed by all reported falls of 50mm or more. |
Highest
and lowest recordings of hours of sunshine for the 24 hours to midnight. |
Highest wind
run totals in kilometres for the 24 hours to 9am (average speed in brackets).
All reported runs >
=25km/h are shown. |
Highest wind
gusts in km/h for the 24 hours to midnight followed by the hour in which it occurred.
All stations with gusts >
89km/h are shown. |
45.0 HOLMLEIGH Central West QLD
38.0 CARINYA Central Highlands QLD
37.0 TE KOWAI EXP STN Central Coast E QLD
37.0 DALRYMPLE HEIGHTS Central Coast E QLD
33.4 BRAMPTON ISLAND RESORT Central Coast E QLD
|
10.8 DARWIN AIRPORT N Rivers NT
10.7 BROOME AIRPORT W Kimberley WA
10.7 RABBIT FLAT N Plateau NT
10.6 GILES METEOROLOGICAL OFFICE Interior WA
10.4 ALICE SPRINGS AIRPORT N Plateau NT
.....
0.7 STRATHGORDON VILLAGE W Coast TAS
0.6 MACKAY M.O Central Coast E QLD
0.2 BRISBANE AERO Brisbane/SE Coast QLD
0.0 WARWICK Darling Downs E QLD
0.0 BRIAN PASTURES Brisbane/SE Coast QLD
|
841 (35.0) HARTZ MOUNTAIN (KEOGHS PIMPLE) Southeast TAS
831 (34.6) MOUNT WELLINGTON Southeast TAS
822 (34.3) CAPE LEEUWIN Lower West WA
796 (33.2) MOUNT READ W Coast TAS
754 (31.4) CAPE WILLOUGHBY Yorke Pen/Kanga Is SA
709 (29.5) WILLIS ISLAND Islands ISL
705 (29.4) CAPE BRUNY (CAPE BRUNY) Southeast TAS
694 (28.9) GREEN CAPE AWS South Coast NSW
685 (28.5) CAPE NATURALISTE Lower West WA
682 (28.4) CAPE GRIM BAPS N Coast TAS
658 (27.4) ROTTNEST ISLAND Lower West WA
634 (26.4) MCCLUER ISLAND N Rivers NT
628 (26.2) STENHOUSE BAY Yorke Pen/Kanga Is SA
627 (26.1) VARANUS ISLAND Islands ISL
623 (26.0) NEPTUNE ISLAND W Agricultural SA
|
83/12 TASMAN ISLAND Southeast TAS
80/12 HARTZ MOUNTAIN (KEOGHS PIMPLE) Southeast TAS
76/23 MOUNT WELLINGTON Southeast TAS
72/23 ROTTNEST ISLAND Lower West WA
72/20 CAPE GRIM BAPS N Coast TAS
|
�