|
For notes on how to interpret
the data and quality control issues, see Daily Weather Summary Help.
**S** and **W** precede data flagged by the Bureau as suspicious or wrong
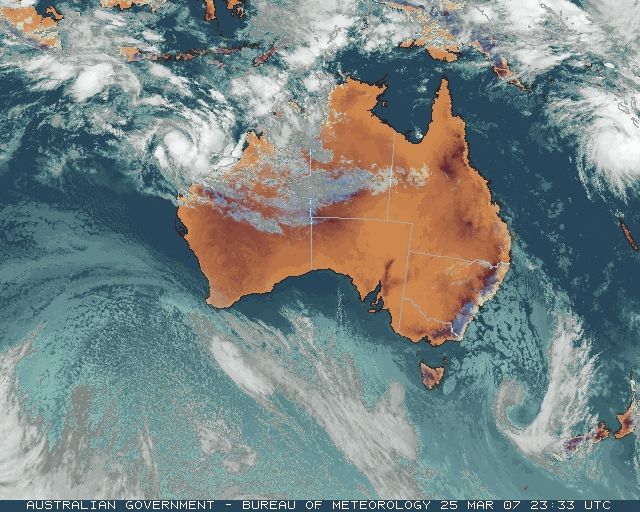
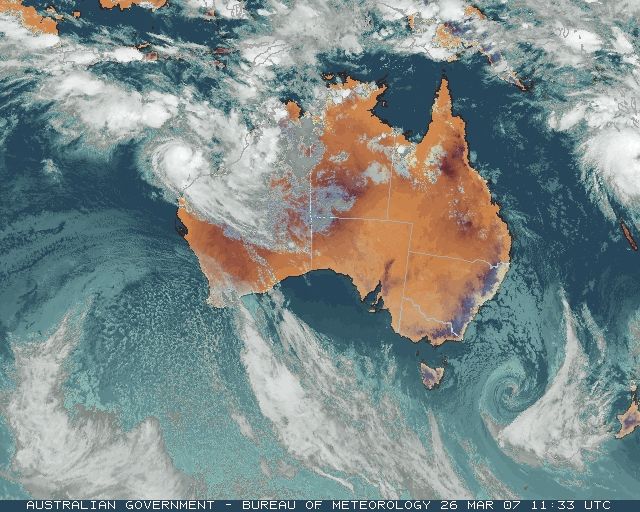
Data is as received at 00:18EST, 15/05/2012.
|
|
| |
Max
°
C |
+/- norm
°
C |
Min
°
C |
+/- norm
°
C |
Grass Min
°
C |
Rain to 9am mm |
Evaporation to 9am mm |
Sunshine hours |
Wind Run to 9am km (24-hour average km/h) |
Maximum Gust km/h / hour of occurrence |
| GERALDTON AIRPORT |
26.2 |
-4.7 |
13.8 |
-4.1 |
11.0 |
0.0 |
10.0 |
-- |
428 (17.8) |
63/16 |
| PERTH AIRPORT |
24.3 |
-5.3 |
7.1 |
-8.7 |
5.9 |
0.0 |
7.6 |
8.5 |
282 (11.8) |
68/16 |
| ALBANY AIRPORT |
22.4 |
-1.7 |
10.1 |
-3.3 |
6.4 |
0.0 |
6.0 |
6.4 |
332 (13.8) |
59/14 |
| BUNBURY |
22.7 |
-4.8 |
11.9 |
-2.1 |
-- |
0.0 |
-- |
-- |
217 ( 9.0) |
52/13 |
| MANDURAH |
22.6 |
-- |
15.8 |
-- |
-- |
0.0 |
-- |
-- |
276 (11.5) |
72/14 |
| DARWIN AIRPORT |
31.8 |
-0.1 |
25.0 |
+0.5 |
25.2 |
0.0 |
2.8 |
4.3 |
251 (10.5) |
30/09 |
| ALICE SPRINGS AIRPORT |
28.1 |
-4.6 |
15.2 |
-2.3 |
14.0 |
0.0 |
8.6 |
7.1 |
439 (18.3) |
34/08 |
| WHYALLA AERO |
23.5 |
-3.8 |
8.6 |
-6.7 |
-- |
0.0 |
4.0 |
-- |
295 (12.3) |
24/13 |
| ADELAIDE (KENT TOWN) |
26.1 |
-0.2 |
11.9 |
-3.3 |
7.7 |
0.0 |
12.4 |
11.2 |
250 (10.4) |
28/03 |
| MOUNT GAMBIER AERO |
24.4 |
+1.3 |
6.1 |
-4.4 |
1.7 |
0.0 |
3.8 |
10.1 |
319 (13.3) |
35/15 |
| MOUNT ISA AERO |
35.8 |
+1.5 |
24.6 |
+2.8 |
23.9 |
0.0 |
11.0 |
4.5 |
477 (19.9) |
39/02 |
| CAIRNS AERO |
31.0 |
+0.5 |
23.1 |
+0.1 |
20.9 |
0.0 |
7.2 |
10.6 |
382 (15.9) |
43/11 |
| TOWNSVILLE AERO |
31.1 |
+0.4 |
23.0 |
+0.1 |
20.3 |
0.0 |
6.6 |
7.6 |
294 (12.3) |
35/12 |
| MACKAY M.O |
28.2 |
-0.4 |
22.9 |
+0.7 |
-- |
0.0 |
-- |
7.9 |
350 (14.6) |
48/23 |
| ROCKHAMPTON AERO |
30.4 |
-0.1 |
21.9 |
+1.1 |
21.3 |
2.0 |
8.0 |
-- |
256 (10.7) |
39/23 |
| BUNDABERG AERO |
27.3 |
-1.8 |
21.2 |
+1.3 |
-- |
2.2 |
6.2 |
-- |
388 (16.2) |
59/11 |
| NAMBOUR DPI |
25.8 |
-2.1 |
19.2 |
+1.0 |
-- |
10.63 |
14.6 |
-- |
123 ( 5.1) |
41/13 |
| COOLANGATTA |
25.3 |
-1.9 |
19.4 |
-0.2 |
-- |
5.8 |
-- |
-- |
639 (26.6) |
70/10 |
| BRISBANE AERO |
27.5 |
-0.5 |
18.6 |
-0.7 |
17.4 |
1.6 |
4.4 |
9.1 |
348 (14.5) |
58/09 |
| TOOWOOMBA AIRPORT |
24.6 |
-1.8 |
14.3 |
-1.8 |
-- |
0.6 |
-- |
-- |
495 (20.6) |
50/16 |
| GUNNEDAH RESOURCE CENTRE |
24.6 |
-4.5 |
14.3 |
-2.3 |
9.9 |
0.0 |
5.4 |
-- |
410 (17.1) |
-- |
| COFFS HARBOUR MO |
23.6 |
-2.3 |
16.3 |
-1.8 |
15.5 |
18.4 |
1.4 |
6.3 |
680 (28.3) |
58/13 |
| PORT MACQUARIE AIRPORT AWS |
23.4 |
-2.9 |
17.4 |
+0.7 |
-- |
21.0 |
-- |
-- |
-- |
-- |
| WILLIAMTOWN RAAF |
22.7 |
-3.5 |
16.6 |
+0.3 |
14.8 |
4.2 |
4.0 |
3.7 |
653 (27.2) |
46/15 |
| GOSFORD (NARARA RESEARCH STATION) AWS |
22.9 |
-3.1 |
12.5 |
-2.8 |
-- |
12.6 |
-- |
-- |
123 ( 5.1) |
30/12 |
| ORANGE AGRICULTURAL INSTITUTE |
19.0 |
-3.8 |
8.9 |
-1.7 |
5.6 |
0.0 |
1.4 |
10.0 |
-- |
-- |
| DUBBO AIRPORT AWS |
26.1 |
-3.0 |
14.4 |
-0.1 |
-- |
0.0 |
-- |
-- |
-- |
-- |
| SYDNEY AIRPORT AMO |
23.1 |
-2.1 |
17.1 |
-0.3 |
15.3 |
1.8 |
5.6 |
4.6 |
871 (36.3) |
48/02 |
| RICHMOND RAAF |
21.6 |
-5.3 |
14.7 |
-0.8 |
-- |
0.8 |
-- |
-- |
306 (12.8) |
34/11 |
| BELLAMBI AWS |
20.9 |
-3.0 |
15.8 |
-2.2 |
-- |
8.8 |
-- |
-- |
759 (31.6) |
52/06 |
| CANBERRA AIRPORT |
17.5 |
-7.0 |
11.3 |
+0.6 |
10.5 |
0.0 |
5.8 |
2.2 |
428 (17.8) |
28/12 |
| WAGGA WAGGA AMO |
23.7 |
-4.0 |
10.8 |
-2.6 |
8.6 |
0.0 |
6.0 |
11.3 |
350 (14.6) |
43/10 |
| ALBURY AIRPORT AWS |
25.0 |
-2.9 |
11.8 |
-0.8 |
-- |
0.0 |
-- |
-- |
325 (13.5) |
30/00 |
| MILDURA AIRPORT |
27.7 |
-0.6 |
9.7 |
-4.1 |
8.0 |
0.0 |
7.8 |
11.0 |
405 (16.9) |
43/14 |
| TATURA INST SUSTAINABLE AG |
25.0 |
-1.3 |
6.9 |
-4.8 |
-- |
0.0 |
22.8 |
-- |
335 (14.0) |
32/13 |
| BENDIGO AIRPORT |
24.0 |
-2.0 |
9.2 |
-2.1 |
-- |
0.0 |
-- |
-- |
491 (20.5) |
�
39/13 |
| MELBOURNE REGIONAL OFFICE |
26.2 |
+2.3 |
9.2 |
-4.0 |
6.8 |
0.0 |
3.4 |
-- |
172 ( 7.2) |
22/12 |
| GEELONG AIRPORT |
23.7 |
+0.5 |
8.1 |
-3.7 |
-- |
0.0 |
-- |
-- |
321 (13.4) |
34/15 |
| BALLARAT AERODROME |
22.9 |
+0.7 |
7.1 |
-2.8 |
-- |
0.0 |
-- |
-- |
564 (23.5) |
43/00 |
| LAUNCESTON (TI TREE BEND) |
21.3 |
-1.2 |
5.1 |
-4.9 |
-- |
0.0 |
-- |
-- |
108 ( 4.5) |
24/16 |
| HOBART AIRPORT |
20.4 |
-0.3 |
7.2 |
-3.5 |
4.8 |
0.0 |
1.0 |
11.0 |
258 (10.8) |
32/14 |
| |
Max
°
C |
+/- norm
°
C |
Min
°
C |
+/- norm
°
C |
Grass Min
°
C |
Rain to 9am mm |
Evaporation to 9am mm |
Sunshine hours |
Wind Run to 9am km |
Maximum Gust km/h / hour of occurrence |
|
| Hottest |
| Highest maximum temperature> | Greatest variation above normal maximum |
Highest minimum temperature | Greatest variation above normal minimum |
39.2 GASCOYNE JUNCTION W Gascoyne WA
39.0 EMU CREEK STATION W Gascoyne WA
38.6 CENTURY MINE Gulf Country QLD
38.1 JULIA CREEK AIRPORT Gulf Country QLD
38.1 CLONCURRY AIRPORT Gulf Country QLD
|
+8.2 : 33.3 ESPERANCE Lower West WA
+7.7 : 33.6 ESPERANCE AERO Lower West WA
+6.7 : 31.7 HOPETOUN NORTH Lower West WA
+6.7 : 31.8 EUCLA Eucla WA
+6.4 : 33.7 SALMON GUMS RES.STN. Goldfields WA
|
27.5 SWEERS ISLAND Gulf Country QLD
27.0 CENTRE ISLAND N Rivers NT
26.9 THEVENARD ISLAND W Pilbara WA
26.8 ONSLOW AIRPORT W Pilbara WA
26.7 ONSLOW W Pilbara WA
|
+5.6 : 26.6 WINTON POST OFFICE Northwest QLD
+4.8 : 21.1 INJUNE POST OFFICE Maranoa QLD
+3.9 : 22.0 TAROOM POST OFFICE Central Highlands QLD
+3.8 : 24.2 TOM PRICE W Pilbara WA
+3.7 : 24.6 RICHMOND AIRPORT Upper Carpentaria QLD
|
| Coldest |
| Lowest maximum temperature | Greatest variation below normal maximum |
Lowest minimum temperature | Greatest variation below normal minimum |
8.0 MOUNT GININI AWS Goulburn/Monaro NSW
9.2 THREDBO AWS Snowy Mtns NSW
10.2 PERISHER VALLEY SKI CENTRE Snowy Mtns NSW
10.3 MT HOTHAM Upper NE VIC
10.6 CABRAMURRA SMHEA AWS SW Slopes S NSW
10.6 MT BAW BAW W Gippsland VIC
10.6 CHARLOTTE PASS (KOSCIUSKO CHALET) Snowy Mtns NSW
|
-10.5 : 24.0 TERRITORY GRAPE FARM N Plateau NT
-9.7 : 26.5 PARDOO STATION E Pilbara WA
-9.5 : 27.3 PORT HEDLAND AIRPORT E Pilbara WA
-9.3 : 24.5 GILES METEOROLOGICAL OFFICE Interior WA
-8.9 : 14.0 COOMA AIRPORT AWS Goulburn/Monaro NSW
|
-1.8 LIAWENEE Central Plateau TAS
-1.4 MT HOTHAM Upper NE VIC
-1.1 THREDBO AWS Snowy Mtns NSW
|
-11.7 : 5.0 ROXBY DOWNS (OLYMPIC DAM AERODROME) NW Pastoral SA
-9.6 : 9.6 OODNADATTA AIRPORT NE Pastoral SA
-9.3 : 5.7 GINGIN AERO Lower West WA
-9.2 : 8.5 MARLA POLICE STATION NW Pastoral SA
-9.0 : 3.5 YUNTA AIRSTRIP Northeast SA
|
|
Sunniest &
dullest |
Windiest |
Highest gusts |
Todays highest rainfall totals for the 24 hours to 9am. It
includes the top 5 totals nationally followed by all reported falls of 50mm or more. |
Highest
and lowest recordings of hours of sunshine for the 24 hours to midnight. |
Highest wind
run totals in kilometres for the 24 hours to 9am (average speed in brackets).
All reported runs >
=25km/h are shown. |
Highest wind
gusts in km/h for the 24 hours to midnight followed by the hour in which it occurred.
All stations with gusts >
89km/h are shown. |
139.0 MOUNT BARNETT W Kimberley WA
99.2 KUNUNURRA AERO E Kimberley WA
95.0 KEEP RIVER RANGERS N Rivers NT
92.4 ARGYLE AERODROME E Kimberley WA
92.3 KUNUNURRA CHECKPOINT E Kimberley WA
WESTERN AUSTRALIA
N Kimberley
72.6 MOUNT ELIZABETH
E Kimberley
99.2 KUNUNURRA AERO
92.4 ARGYLE AERODROME
92.3 KUNUNURRA CHECKPOINT
91.2 GIBB RIVER
50.0 MORNINGTON AIRSTRIP
W Kimberley
139.0 MOUNT BARNETT
76.0 KIMBERLEY DOWNS
75.0 CHARNLEY RIVER
69.5 BIDYADANGA
65.2 CURTIN AERO
57.8 LEOPOLD DOWNS
55.4 BLINA
NORTHERN TERRITORY
N Rivers
95.0 KEEP RIVER RANGERS
67.4 CHANNEL POINT
65.0 MIDDLE POINT AWS
62.0 BEATRICE HILL
59.4 UPPER ADELAIDE RIVER
57.8 WARRUWI
QUEENSLAND
N Peninsula
58.0 AURUKUN SHIRE COUNCIL
Wide Bay/Burnett
50.4 GOONDICUM
Brisbane/SE Coast
55.0 MARODIAN TM
54.6 DANEWOOD VALE
NEW SOUTH WALES
MidNorth Coast N
50.0 LEIGH (ROLLING ACRES)
MidNorth Coast S
56.4 COMBOYNE SOUTH
|
11.5 MELBOURNE AIRPORT E Central VIC
11.4 WOOMERA AERODROME NW Pastoral SA
11.4 LOXTON RESEARCH CENTRE Murray Valley SA
11.3 WAGGA WAGGA AMO SW Slopes S NSW
11.2 CEDUNA AMO W Agricultural SA
11.2 ADELAIDE (KENT TOWN) Adelaide/Lofty SA
.....
4.3 DARWIN AIRPORT N Rivers NT
3.7 WILLIAMTOWN RAAF Hunter Valley NSW
3.4 ALSTONVILLE TROPICAL FRUIT RESEARCH STAT North Coast NSW
2.2 CANBERRA AIRPORT Goulburn/Monaro NSW
0.1 GILES METEOROLOGICAL OFFICE Interior WA
|
1121 (46.7) MURRURUNDI GAP AWS Hunter Valley NSW
1048 (43.7) NORAH HEAD AWS Hunter Valley NSW
1036 (43.2) CAPE MORETON LIGHTHOUSE Brisbane/SE Coast QLD
1034 (43.1) NEWCASTLE NOBBYS SIGNAL STATION AWS Hunter Valley NSW
983 (41.0) BYRON BAY (CAPE BYRON AWS) North Coast NSW
871 (36.3) SYDNEY AIRPORT AMO Sydney--east NSW
854 (35.6) MONTAGUE ISLAND LIGHTHOUSE South Coast NSW
853 (35.5) EVANS HEAD RAAF BOMBING RANGE AWS North Coast NSW
847 (35.3) DOUBLE ISLAND POINT LIGHTHOUSE Brisbane/SE Coast QLD
759 (31.6) BELLAMBI AWS Illawarra NSW
739 (30.8) CAPE WILLOUGHBY Yorke Pen/Kanga Is SA
737 (30.7) CABRAMURRA SMHEA AWS SW Slopes S NSW
730 (30.4) GREEN CAPE AWS South Coast NSW
680 (28.3) COFFS HARBOUR MO MidNorth Coast N NSW
677 (28.2) WILLIS ISLAND Islands ISL
671 (28.0) NULLO MOUNTAIN AWS C Tablelands N NSW
666 (27.8) GUNNEDAH AIRPORT AWS NW Slopes S NSW
660 (27.5) HAMILTON ISLAND AIRPORT Central Coast E QLD
653 (27.2) WILLIAMTOWN RAAF Hunter Valley NSW
642 (26.8) MAATSUYKER ISLAND LIGHTHOUSE Southeast TAS
639 (26.6) COOLANGATTA Brisbane/SE Coast QLD
635 (26.5) GLEN INNES AIRPORT AWS N Tablelands W NSW
631 (26.3) LOW ISLES LIGHTHOUSE N Coast--Barron QLD
629 (26.2) RUNDLE ISLAND Wide Bay/Burnett QLD
622 (25.9) NARRABRI AIRPORT AWS NW Slopes N NSW
618 (25.8) ULLADULLA AWS South Coast NSW
601 (25.0) MOUNT CRAWFORD FIRE TOWER Adelaide/Lofty SA
601 (25.0) COLAC (MT GELLIBRAND) W Coast VIC
|
104/11 DOUBLE ISLAND POINT LIGHTHOUSE Brisbane/SE Coast QLD
91/01 BYRON BAY (CAPE BYRON AWS) North Coast NSW
87/18 ROTTNEST ISLAND Lower West WA
87/12 CAPE NATURALISTE Lower West WA
83/19 HOPETOUN NORTH Lower West WA
|
�