|
For notes on how to interpret
the data and quality control issues, see Daily Weather Summary Help.
**S** and **W** precede data flagged by the Bureau as suspicious or wrong
Data is as received at 01:12EST, 15/05/2012.
|
|
| |
Max
°
C |
+/- norm
°
C |
Min
°
C |
+/- norm
°
C |
Grass Min
°
C |
Rain to 9am mm |
Evaporation to 9am mm |
Sunshine hours |
Wind Run to 9am km (24-hour average km/h) |
Maximum Gust km/h / hour of occurrence |
| GERALDTON AIRPORT |
22.7 |
+0.7 |
5.6 |
-3.7 |
2.0 |
0.0 |
3.4 |
-- |
313 (13.0) |
35/14 |
| PERTH AIRPORT |
22.0 |
+1.9 |
8.0 |
-0.9 |
6.1 |
0.0 |
3.4 |
9.8 |
309 (12.9) |
35/09 |
| ALBANY AIRPORT |
18.4 |
+1.1 |
2.7 |
-5.3 |
0.9 |
0.0 |
1.8 |
8.8 |
152 ( 6.3) |
32/14 |
| BUNBURY |
19.2 |
+1.0 |
7.5 |
-1.0 |
-- |
0.0 |
-- |
-- |
189 ( 7.9) |
34/15 |
| MANDURAH |
19.3 |
-- |
10.3 |
-- |
-- |
0.0 |
-- |
-- |
200 ( 8.3) |
34/08 |
| DARWIN AIRPORT |
33.7 |
+1.2 |
20.6 |
-2.4 |
18.5 |
0.0 |
7.8 |
10.6 |
298 (12.4) |
41/12 |
| ALICE SPRINGS AIRPORT |
26.3 |
-1.0 |
2.4 |
-8.0 |
-2.0 |
0.0 |
7.4 |
11.5 |
272 (11.3) |
34/16 |
| WHYALLA AERO |
26.4 |
+4.9 |
5.3 |
-2.7 |
-- |
0.0 |
6.6 |
-- |
158 ( 6.6) |
54/15 |
| ADELAIDE (KENT TOWN) |
23.3 |
+4.3 |
14.1 |
+4.4 |
9.3 |
0.0 |
4.8 |
3.3 |
371 (15.5) |
41/00 |
| MOUNT GAMBIER AERO |
20.2 |
+4.4 |
8.1 |
+1.8 |
-- |
0.0 |
4.0 |
8.3 |
448 (18.7) |
46/10 |
| MOUNT ISA AERO |
27.8 |
-3.4 |
10.8 |
-3.4 |
8.5 |
0.0 |
6.8 |
11.2 |
270 (11.3) |
41/15 |
| CAIRNS AERO |
28.6 |
+0.6 |
19.5 |
+0.8 |
17.1 |
0.0 |
6.0 |
9.0 |
449 (18.7) |
37/12 |
| TOWNSVILLE AERO |
27.3 |
-0.4 |
17.1 |
-0.2 |
15.1 |
0.2 |
6.4 |
6.8 |
398 (16.6) |
34/02 |
| MACKAY M.O |
22.1 |
-3.1 |
17.0 |
+0.4 |
-- |
1.4 |
-- |
6.6 |
387 (16.1) |
43/06 |
| ROCKHAMPTON AERO |
21.8 |
-5.5 |
15.4 |
+1.8 |
15.0 |
22.2 |
2.4 |
-- |
426 (17.8) |
37/10 |
| BUNDABERG AERO |
19.1 |
-6.3 |
14.5 |
+0.8 |
-- |
24.6 |
2.0 |
-- |
696 (29.0) |
48/01 |
| NAMBOUR DPI |
15.9 |
-9.0 |
13.2 |
+2.6 |
-- |
27.0 |
3.0 |
-- |
195 ( 8.1) |
34/15 |
| COOLANGATTA |
17.1 |
-6.0 |
13.5 |
+0.1 |
-- |
11.2 |
-- |
-- |
506 (21.1) |
54/14 |
| BRISBANE AERO |
16.4 |
-7.8 |
13.0 |
+0.3 |
12.8 |
10.0 |
0.4 |
0.0 |
492 (20.5) |
48/14 |
| TOOWOOMBA AIRPORT |
11.9 |
-10.5 |
8.7 |
-1.9 |
-- |
14.2 |
-- |
-- |
763 (31.8) |
52/01 |
| GUNNEDAH RESOURCE CENTRE |
18.8 |
-2.6 |
9.4 |
+0.9 |
7.3 |
0.0 |
3.6 |
-- |
364 (15.2) |
-- |
| COFFS HARBOUR MO |
17.2 |
-4.7 |
12.9 |
+2.0 |
12.1 |
9.8 |
2.8 |
0.4 |
595 (24.8) |
48/06 |
| PORT MACQUARIE AIRPORT AWS |
17.8 |
-4.7 |
11.5 |
+2.1 |
-- |
7.0 |
-- |
-- |
-- |
-- |
| WILLIAMTOWN RAAF |
17.7 |
-3.5 |
11.6 |
+2.6 |
10.0 |
4.0 |
5.4 |
1.6 |
545 (22.7) |
43/13 |
| GOSFORD (NARARA RESEARCH STATION) AWS |
17.2 |
-4.1 |
8.8 |
+1.1 |
-- |
5.4 |
-- |
-- |
137 ( 5.7) |
34/11 |
| ORANGE AGRICULTURAL INSTITUTE |
12.5 |
-1.5 |
3.6 |
-0.6 |
-0.6 |
0.0 |
2.6 |
9.8 |
-- |
-- |
| DUBBO AIRPORT AWS |
18.4 |
-2.8 |
4.5 |
-1.9 |
-- |
0.0 |
-- |
-- |
-- |
-- |
| SYDNEY AIRPORT AMO |
18.5 |
-2.0 |
12.2 |
+1.9 |
8.4 |
2.2 |
5.8 |
5.9 |
656 (27.3) |
-- |
| RICHMOND RAAF |
16.7 |
-6.0 |
8.5 |
+0.4 |
-- |
1.6 |
-- |
-- |
184 ( 7.7) |
41/14 |
| BELLAMBI AWS |
16.4 |
-3.8 |
12.5 |
0.0 |
-- |
3.2 |
-- |
-- |
625 (26.0) |
52/08 |
| CANBERRA AIRPORT |
14.4 |
-1.8 |
4.3 |
+1.1 |
1.9 |
0.6 |
2.4 |
7.9 |
287 (12.0) |
43/14 |
| WAGGA WAGGA AMO |
18.5 |
+0.9 |
2.7 |
-2.4 |
-0.6 |
0.0 |
4.6 |
10.6 |
391 (16.3) |
45/11 |
| ALBURY AIRPORT AWS |
18.0 |
-0.1 |
2.3 |
-3.6 |
-- |
0.0 |
-- |
-- |
95 ( 4.0) |
24/09 |
| MILDURA AIRPORT |
22.0 |
+1.6 |
9.7 |
+2.3 |
4.1 |
0.0 |
6.0 |
10.1 |
374 (15.6) |
32/08 |
| TATURA INST SUSTAINABLE AG |
18.2 |
+0.8 |
4.7 |
-0.7 |
-- |
0.0 |
3.6 |
-- |
345 (14.4) |
35/09 |
| BENDIGO AIRPORT |
16.9 |
+0.1 |
3.1 |
-1.2 |
-- |
0.0 |
-- |
-- |
382 (15.9) |
�
34/08 |
| MELBOURNE REGIONAL OFFICE |
20.5 |
+3.3 |
7.8 |
-0.1 |
4.7 |
0.0 |
2.4 |
-- |
99 ( 4.1) |
24/12 |
| GEELONG AIRPORT |
18.4 |
+1.6 |
2.4 |
-4.3 |
-- |
0.0 |
-- |
-- |
214 ( 8.9) |
37/12 |
| BALLARAT AERODROME |
14.6 |
+0.7 |
2.4 |
-2.4 |
-- |
0.0 |
-- |
-- |
562 (23.4) |
45/01 |
| LAUNCESTON (TI TREE BEND) |
16.3 |
+0.8 |
7.2 |
+2.1 |
-- |
0.0 |
-- |
-- |
199 ( 8.3) |
34/10 |
| HOBART AIRPORT |
17.5 |
+2.2 |
3.5 |
-2.5 |
-1.0 |
0.0 |
4.8 |
8.7 |
423 (17.6) |
35/11 |
| |
Max
°
C |
+/- norm
°
C |
Min
°
C |
+/- norm
°
C |
Grass Min
°
C |
Rain to 9am mm |
Evaporation to 9am mm |
Sunshine hours |
Wind Run to 9am km |
Maximum Gust km/h / hour of occurrence |
|
| Hottest |
| Highest maximum temperature> | Greatest variation above normal maximum |
Highest minimum temperature | Greatest variation above normal minimum |
37.0 CURTIN AERO W Kimberley WA
36.4 WEST ROEBUCK W Kimberley WA
36.2 MARBLE BAR E Pilbara WA
36.1 FITZROY CROSSING AERO W Kimberley WA
35.6 ROEBOURNE E Pilbara WA
|
+6.3 : 25.5 ELLISTON W Agricultural SA
+6.2 : 24.0 EDITHBURGH Yorke Pen/Kanga Is SA
+6.1 : 24.2 ADELAIDE AIRPORT Adelaide/Lofty SA
+6.0 : 24.2 STENHOUSE BAY Yorke Pen/Kanga Is SA
+5.7 : 25.9 STREAKY BAY W Agricultural SA
+5.7 : 31.3 MEEKATHARRA AIRPORT E Gascoyne WA
+5.7 : 31.5 YEELIRRIE Goldfields WA
|
26.0 NORTHERN ENDEAVOUR Islands ISL
25.1 COCOS ISLAND AIRPORT Islands ISL
23.9 COCONUT ISLAND N Peninsula QLD
23.7 MCCLUER ISLAND N Rivers NT
23.5 HORN ISLAND N Peninsula QLD
|
+5.7 : 12.0 PINDARI DAM NW Slopes N NSW
+5.3 : 13.6 PARAFIELD AIRPORT Adelaide/Lofty SA
+5.1 : 12.9 TEXAS POST OFFICE Darling Downs E QLD
+5.1 : 7.0 WOOLBROOK (DANGLEMAH ROAD) NW Slopes S NSW
+5.1 : 10.0 WYNYARD AIRPORT N Coast TAS
|
| Coldest |
| Lowest maximum temperature | Greatest variation below normal maximum |
Lowest minimum temperature | Greatest variation below normal minimum |
2.1 THREDBO AWS Snowy Mtns NSW
5.0 MT HOTHAM Upper NE VIC
5.0 PERISHER VALLEY SKI CENTRE Snowy Mtns NSW
5.4 MOUNT BULLER Upper NE VIC
|
-11.5 : 15.2 MILES CONSTANCE STREET Darling Downs W QLD
-11.4 : 12.3 WARWICK Darling Downs E QLD
-11.2 : 15.7 TOOLARA (KELLY) Brisbane/SE Coast QLD
-11.0 : 15.7 ROMA AIRPORT Maranoa QLD
-10.8 : 17.7 ROLLESTON METEOR ST Central Highlands QLD
-10.8 : 15.3 INJUNE POST OFFICE Maranoa QLD
|
-4.7 THREDBO AWS Snowy Mtns NSW
-4.0 MT HOTHAM AIRPORT Upper NE VIC
-4.0 THREDBO VILLAGE Snowy Mtns NSW
-3.4 MT HOTHAM Upper NE VIC
-3.1 OMEO COMPARISON Upper NE VIC
|
-9.3 : 5.4 RABBIT FLAT N Plateau NT
-8.8 : 6.1 ALI CURUNG N Plateau NT
-8.7 : 6.3 MOUNT ELIZABETH N Kimberley WA
-8.6 : 8.5 LAJAMANU N Rivers NT
-8.6 : 9.7 VICTORIA RIVER DOWNS N Rivers NT
|
|
Sunniest &
dullest |
Windiest |
Highest gusts |
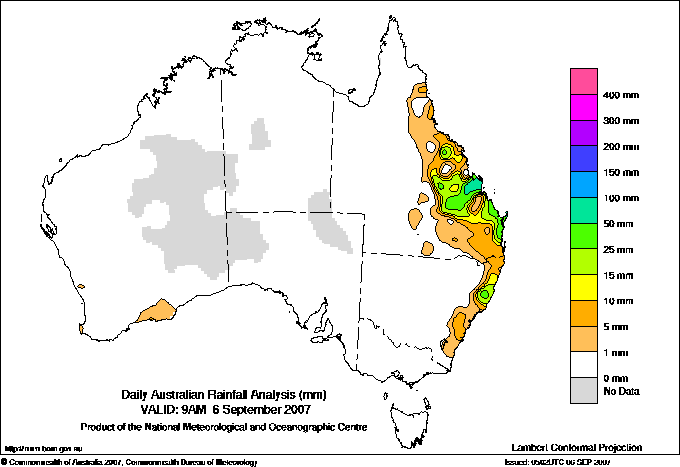
Todays highest rainfall totals for the 24 hours to 9am. It
includes the top 5 totals nationally followed by all reported falls of 50mm or more. |
Highest
and lowest recordings of hours of sunshine for the 24 hours to midnight. |
Highest wind
run totals in kilometres for the 24 hours to 9am (average speed in brackets).
All reported runs >
=25km/h are shown. |
Highest wind
gusts in km/h for the 24 hours to midnight followed by the hour in which it occurred.
All stations with gusts >
89km/h are shown. |
225.0 MONAVALE Central Coast E QLD
173.0 THE GAP TM Central Coast E QLD
155.0 YAAMBA Central Coast E QLD
106.8 THE GLEN TM Central Coast E QLD
98.2 REDBANK Wide Bay/Burnett QLD
QUEENSLAND
Central Coast E
225.0 MONAVALE
173.0 THE GAP TM
155.0 YAAMBA
106.8 THE GLEN TM
88.0 BYFIELD CHILDS ROAD
72.2 SAMUEL HILL AERO
70.6 SOUTH YAAMBA TM
64.0 BELMONT CSIRO
Central Coast W
50.0 ALAMEDA DOWNS
Central Highlands
59.0 DUARINGA POST OFFICE
56.0 CARINYA
51.0 WOORABINDA
Wide Bay/Burnett
98.2 REDBANK
95.8 LADY ELLIOT ISLAND
73.4 SANDY CAPE LIGHTHOUSE
Brisbane/SE Coast
84.0 POINT ARKWRIGHT
69.0 EUMUNDI - CRESCENT RD
64.8 COMO
63.6 MALENY TAMARIND ST
63.2 COOROY COMPOSITE
62.0 MAROOCHYDORE AERO
58.0 MALENY DENNING RD
56.0 KINGFISHER BAY RESORT
54.2 MALENY MARY CAIRNCROSS AVE
51.6 TOOLARA (KELLY)
NEW SOUTH WALES
MidNorth Coast N
68.6 DORRIGO (OLD CORAMBA RD)
54.0 PROMISED LAND (BELLINGEN (CRYSTAL CREEKS
|
11.5 ALICE SPRINGS AIRPORT N Plateau NT
11.3 TENNANT CREEK AIRPORT N Plateau NT
11.2 GILES METEOROLOGICAL OFFICE Interior WA
11.2 MOUNT ISA AERO Gulf Country QLD
11.1 RABBIT FLAT N Plateau NT
.....
0.3 WARWICK Darling Downs E QLD
0.0 BRISBANE AERO Brisbane/SE Coast QLD
0.0 NORFOLK ISLAND AERO Islands ISL
0.0 ALSTONVILLE TROPICAL FRUIT RESEARCH STAT North Coast NSW
0.0 BRIAN PASTURES Brisbane/SE Coast QLD
|
1502 (62.6) CAPE MORETON LIGHTHOUSE Brisbane/SE Coast QLD
1478 (61.6) DOUBLE ISLAND POINT LIGHTHOUSE Brisbane/SE Coast QLD
1339 (55.8) RUNDLE ISLAND Wide Bay/Burnett QLD
1283 (53.5) MOUNT READ W Coast TAS
1200 (50.0) BYRON BAY (CAPE BYRON AWS) North Coast NSW
1194 (49.8) LORD HOWE ISLAND AERO Islands ISL
947 (39.5) LADY ELLIOT ISLAND Wide Bay/Burnett QLD
941 (39.2) GOLD COAST SEAWAY Brisbane/SE Coast QLD
915 (38.1) WILLIS ISLAND Islands ISL
904 (37.7) MOUNT WELLINGTON Southeast TAS
859 (35.8) NEWCASTLE NOBBYS SIGNAL STATION AWS Hunter Valley NSW
827 (34.5) HOGAN ISLAND Islands ISL
821 (34.2) GLEN INNES AIRPORT AWS N Tablelands W NSW
801 (33.4) LUNCHEON HILL (FORESTRY) N Coast TAS
775 (32.3) GREEN CAPE AWS South Coast NSW
764 (31.8) NORAH HEAD AWS Hunter Valley NSW
763 (31.8) TOOWOOMBA AIRPORT Darling Downs E QLD
756 (31.5) HERON ISLAND RES STN Wide Bay/Burnett QLD
732 (30.5) MAROOCHYDORE AERO Brisbane/SE Coast QLD
724 (30.2) EVANS HEAD RAAF BOMBING RANGE AWS North Coast NSW
717 (29.9) COCOS ISLAND AIRPORT Islands ISL
711 (29.6) MURRURUNDI GAP AWS Hunter Valley NSW
706 (29.4) OAKEY AERO Darling Downs E QLD
706 (29.4) MCCLUER ISLAND N Rivers NT
697 (29.0) WALLAN (KILMORE GAP) N Central VIC
696 (29.0) BUNDABERG AERO Wide Bay/Burnett QLD
678 (28.3) CAPE GRIM BAPS N Coast TAS
660 (27.5) GLADSTONE RADAR Wide Bay/Burnett QLD
659 (27.5) CARNARVON AIRPORT W Gascoyne WA
657 (27.4) CAPE FLATTERY N Coast--Barron QLD
656 (27.3) SYDNEY AIRPORT AMO Sydney--east NSW
654 (27.3) LOW ISLES LIGHTHOUSE N Coast--Barron QLD
645 (26.9) SMITHTON AERODROME N Coast TAS
643 (26.8) TASMAN ISLAND Southeast TAS
642 (26.8) EMERALD AIRPORT Central Highlands QLD
631 (26.3) HAMILTON ISLAND AIRPORT Central Coast E QLD
625 (26.0) BELLAMBI AWS Illawarra NSW
623 (26.0) MT HOTHAM Upper NE VIC
620 (25.8) THREDBO AWS Snowy Mtns NSW
618 (25.8) NULLO MOUNTAIN AWS C Tablelands N NSW
618 (25.8) EDDYSTONE POINT E Coast TAS
615 (25.6) MONTAGUE ISLAND LIGHTHOUSE South Coast NSW
614 (25.6) ARMIDALE AIRPORT AWS N Tablelands W NSW
603 (25.1) WILSONS PROMONTORY LIGHTHOUSE W Gippsland VIC
|
102/00 MOUNT READ W Coast TAS
85/01 DOUBLE ISLAND POINT LIGHTHOUSE Brisbane/SE Coast QLD
83/19 CAPE MORETON LIGHTHOUSE Brisbane/SE Coast QLD
76/04 RUNDLE ISLAND Wide Bay/Burnett QLD
76/01 BYRON BAY (CAPE BYRON AWS) North Coast NSW
|
�