Thursday 11 JAN 2007
 

Home page

DWS ARCHIVE
2024 2023 2022 2021 2020 2019 2018 2017 2016 2015 2014 2013 2012 2011 2010 2009 2008 2007 2006 2005 2004 2003
Before 2003

About the DWS


2007

Dec

M Tu W Th F Sa Su
          01 02
03 04 05 06 07 08 09
10 11 12 13 14 15 16
17 18 19 20 21 22 23
24 25 26 27 28 29 30
31            

Nov

M Tu W Th F Sa Su
      01 02 03 04
05 06 07 08 09 10 11
12 13 14 15 16 17 18
19 20 21 22 23 24 25
26 27 28 29 30    

Oct

M Tu W Th F Sa Su
01 02 03 04 05 06 07
08 09 10 11 12 13 14
15 16 17 18 19 20 21
22 23 24 25 26 27 28
29 30 31        

Sept

M Tu W Th F Sa Su
          01 02
03 04 05 06 07 08 09
10 11 12 13 14 15 16
17 18 19 20 21 22 23
24 25 26 27 28 29 30

August

M Tu W Th F Sa Su
    01 02 03 04 05
06 07 08 09 10 11 12
13 14 15 16 17 18 19
20 21 22 23 24 25 26
27 28 29 30 31    

July

M Tu W Th F Sa Su
            01
02 03 04 05 06 07 08
09 10 11 12 13 14 15
16 17 18 19 20 21 22
23 24 25 26 27 28 29
30 31          

June

M Tu W Th F Sa Su
        01 02 03
04 05 06 07 08 09 10
11 12 13 14 15 16 17
18 19 20 21 22 23 24
25 26 27 28 29 30  

May

M Tu W Th F Sa Su
  01 02 03 04 05 06
07 08 09 10 11 12 13
14 15 16 17 18 19 20
21 22 23 24 25 26 27
28 29 30 31      

April

M Tu W Th F Sa Su
            01
02 03 04 05 06 07 08
09 10 11 12 13 14 15
16 17 18 19 20 21 22
23 24 25 26 27 28 29
30            

March

M Tu W Th F Sa Su
      01 02 03 04
05 06 07 08 09 10 11
12 13 14 15 16 17 18
19 20 21 22 23 24 25
26 27 28 29 30 31  

February

M Tu W Th F Sa Su
      01 02 03 04
05 06 07 08 09 10 11
12 13 14 15 16 17 18
19 20 21 22 23 24 25
26 27 28        

January

M Tu W Th F Sa Su
01 02 03 04 05 06 07
08 09 10 11 12 13 14
15 16 17 18 19 20 21
22 23 24 25 26 27 28
29 30 31        

Monthly summaries:
from BoM

Find a place:
Google Maps |
Aust Gazetteer|
Geonames

Weather terms:
WeatherZone | BoM |
American Met Soc | NOAA | uk.sci.weather | India Meteorological Department

National Daily Weather Summary

Records set | Charts | Cities | Hottest | Coldest | Rain, sun & wind | Downpours & gales
State extremes | Noteworthy weather | Capital Cities | Regional Cities | Alpine Stations
Charts and data courtesy Bureau of Meteorology. MTSAT-1R operated by JMA
Noteworthy weather today
significant newsworthy major
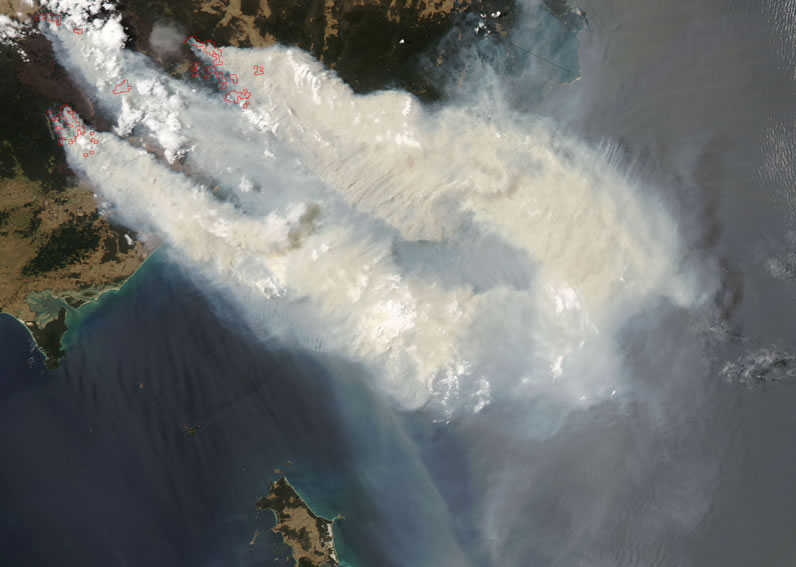
This NASA MODIS image shows in red outline the areas currently burning today, and the huge smoke plume extending SE past Flinders Island, at the bottom centre. The plume blew across Tasmania for part of the day, enveloping much of the state in smoke. MODIS

SA, NSW, VIC, TAS: Firies battle blazes as temperatures soar. Single-digit humidities, temperatures 10 to 16 above average and strong to gale-force northerly winds created the worst-possible fire scenario across much of the Southeast of the continent. A boisterous southwesterly change crossed VIC and TAS during the day, dropping temperatures about 15C but bringing virtually no rain. In Melbourne, the overnight temperature dropped from 36.9 at 6pm yesterday to 28.6 at 5.30 this morning before rising again, bringing it close to the record high January minimum temperature of 28.8 in 151 years of record. However, the official minimum figure for the period from 9am yesterday to 9am today was 20.3, the temperature at 9am yesterday. The official minimum for Melbourne Airport was 26.3 and Moorabbin Airport 27.8, just 0.2 below its all-time record in 33 years. In East Gippsland, Gelantipy recorded a January record high maximum temperature of 36.0 in a 13-year history. Temperatures in TAS were also high before the change, reaching 35C at Swansea, but recent rain diminished the bushfire threat. In NSW, many locations in the state's west reached 44 or 45C.

The Great Divide fire, which has now burnt in excess of 9,000sq km, jumped containment lines on its northern and southern flanks, threatening the ski village at Mt Buller in the north, and settlements in the Tambo valley south of Omeo and along a line from Bullumwaal through Bruthen to Buchan in the south. Farm outbuildings, fencing and pastures were destroyed at Tambo Crossing, where there were also reports of heavy stock losses and one unoccupied house lost. Flames were within 1km of Mt Buller and 1.5km of Bruthen. The dry wind change, which arrived mid-afternoon, caused more problems for firefighters with embers reportedly carried up to 15km ahead of the main blaze. Lightning from storms with the front ignited at least 9 new fires, most in the Marysville area. One broke out NE of Tatong, 20km SE of Benalla, burning through 20sq km by Friday morning. Another fire in the Purnim to Framlingham area 20km NE of Warrnambool burnt through over 11sq km of Framlingham Forest, where it is believed to have killed countless koalas and other wildlife. The forest is one of the last remnants of native vegetation in SW VIC, and many rare mature manna gums were destroyed in the fire. There were evacuations in Framlingham, Purnim and Panmure as 140 firefighters attended the fire and several related spotfires. The fire was later contained after burning 16sq km.

Other small fires were reported around Buxton, Corryong, Whitfield, the Dandenongs and Mount Martha on the Mornington Peninsula.

WA, NT, QLD: Monsoon in full swing. As the surface charts below show, the monsoon trough is now firmly in place from the WA Kimberley to Cape York Peninsula, and monsoonal showers and thunderstorms are continuing to drop relatively modest falls, heavy in places, across the tropical north. Highest 24-hour totals continue to be of the order of 50 to 70mm, but often coming in the form of heavy downpours, such as the 50.4 deluge in 34 minutes at Camooweal this morning, 7.2mm of which fell in 3 minutes (see downpours for more).


Records set or equalled today

These records are based on data received as at 2330 EST on 20/08/2008. Help in interpreting these statistics and information on quality control is here.

District Site Today Previous monthly record Previous all time record
if equalled or broken
Comments
Reading Reading Date Years Reading Date Years
Highest maximum temperature

VIC

Lower NE

082076

DARTMOUTH RESERVOIR

40.2

39.7

31/01/1983

29

1 Y

VIC

E Gippsland

084142

GELANTIPY

36.3

35.6

17/01/1998

13

1 Y

VIC

E Gippsland

084143

COMBIENBAR AWS

40.2

39.5

22/01/2006

13

39.5

22/01/2006

14

1 Y


The day in charts
Surface charts Satellite images Rain & temperatures
4am EST Rainfall -- 24 hours to 9am
Available about 6am EST Available about 4am EST Available about 2pm EST
Week to 9am | SE AUS detail
10am EST Minimum temperature +/- normal
Available about noon EST Available about 10am EST Available about 2pm EST next day
Actual temperatures
4pm EST Maximum temperature +/- normal
Available about 6pm EST Available about 4pm EST Available about 2pm EST next day
Actual temperatures
10pm EST Solar Radiation
Available about midnight EST Available about 10pm EST Available about 2am EST next day

Summary of observations

For notes on how to interpret the data and quality control issues, see Daily Weather Summary Help.
**S** and **W** precede data flagged by the Bureau as suspicious or wrong
Data is as received at 23:55EST, 14/05/2012.

Major centres
Max
° C
+/- norm
° C
Min
° C
+/- norm
° C
Grass Min
° C
Rain to 9am mm Evaporation to 9am mm Sunshine hours Wind Run to 9am km (24-hour average km/h) Maximum Gust km/h / hour of occurrence
GERALDTON AIRPORT 26.7 -4.9 17.9 -0.4 17.2 0.0 8.0 -- 510 (21.3) 58/18
PERTH AIRPORT 24.7 -6.9 13.5 -3.4 13.3 2.2 5.0 7.9 407 (17.0) 41/16
ALBANY AIRPORT 23.2 -1.5 12.2 -1.5 10.0 6.0 5.4 8.7 409 (17.0) 55/16
BUNBURY 23.4 -6.0 11.2 -3.9 -- 0.0 -- -- 281 (11.7) 39/15
MANDURAH 22.5 -- 15.6 -- -- 2.0 -- -- 381 (15.9) 37/18
DARWIN AIRPORT 31.1 -0.7 25.7 +0.9 25.7 6.4 8.2 3.5 365 (15.2) 50/18
ALICE SPRINGS AIRPORT 35.1 -1.3 26.1 +4.7 25.6 0.0 12.8 1.5 418 (17.4) 50/16
WHYALLA AERO 28.4 -1.5 18.4 +1.0 -- 0.0 20.0 -- 634 (26.4) 46/23
ADELAIDE (KENT TOWN) 28.9 -0.2 18.2 +1.2 14.1 0.0 12.0 12.6 401 (16.7) 35/15
MOUNT GAMBIER AERO 25.7 +0.5 15.2 +4.1 -- 0.0 16.6 13.6 591 (24.6) 52/14
MOUNT ISA AERO 36.7 +0.4 24.4 +0.6 23.4 2.0 7.4 5.8 304 (12.7) 59/15
CAIRNS AERO 33.0 +1.6 26.9 +3.2 25.4 0.0 8.2 4.0 532 (22.2) 34/13
TOWNSVILLE AERO 32.4 +1.1 27.2 +3.0 25.6 0.0 9.2 7.9 402 (16.8) 41/13
MACKAY M.O 32.0 +1.9 23.9 +0.4 -- 0.0 -- 11.5 337 (14.0) 26/15
ROCKHAMPTON AERO 35.0 +3.1 23.6 +1.5 22.2 0.0 8.0 -- 281 (11.7) 50/04
BUNDABERG AERO 32.4 +2.3 23.2 +1.8 -- 0.0 6.3 -- 259 (10.8) 39/14
NAMBOUR DPI 29.8 +0.5 22.2 +2.8 -- 3.6 1.8 -- 53 ( 2.2) 24/11
COOLANGATTA 28.0 -0.1 19.5 -1.5 -- 0.0 -- -- 149 ( 6.2) 28/13
BRISBANE AERO 29.1 +0.1 23.1 +2.0 22.1 0.0 2.8 7.6 273 (11.4) 34/14
TOOWOOMBA AIRPORT 31.1 +3.0 18.5 +1.0 -- 0.6 -- -- 627 (26.1) 45/20
GUNNEDAH RESOURCE CENTRE 38.5 +6.6 21.9 +3.1 15.9 0.0 9.0 -- 115 ( 4.8) --
COFFS HARBOUR MO 27.5 +0.6 16.9 -2.5 13.9 0.0 5.0 12.8 298 (12.4) 55/15
PORT MACQUARIE AIRPORT AWS 28.0 +0.6 15.5 -2.6 -- 0.0 -- -- -- --
WILLIAMTOWN RAAF 34.7 +6.8 13.3 -4.7 11.2 0.0 8.0 12.5 309 (12.9) 41/16
GOSFORD (NARARA RESEARCH STATION) AWS 32.3 +4.8 14.2 -2.5 -- 0.0 -- -- 104 ( 4.3) 26/14
ORANGE AGRICULTURAL INSTITUTE 33.4 +6.9 14.2 +1.0 9.6 0.0 9.4 13.4 -- --
DUBBO AIRPORT AWS 38.9 +5.8 20.1 +2.0 -- 0.0 -- -- -- --
SYDNEY AIRPORT AMO 29.7 +3.3 19.1 +0.4 14.3 0.0 9.0 12.4 392 (16.3) 58/17
RICHMOND RAAF 39.4 +9.6 15.1 -2.3 -- 0.0 -- -- 170 ( 7.1) 37/16
BELLAMBI AWS 24.4 -0.4 16.8 -2.1 -- 0.0 -- -- 237 ( 9.9) 31/17
CANBERRA AIRPORT 38.0 +10.0 13.1 -0.1 8.6 0.0 11.2 13.2 273 (11.4) 48/12
WAGGA WAGGA AMO 41.6 +10.0 13.2 -3.0 9.4 0.0 12.0 12.8 258 (10.8) 41/12
ALBURY AIRPORT AWS 42.4 +10.2 14.1 -2.5 -- 0.0 -- -- 105 ( 4.4) 52/13
MILDURA AIRPORT 38.3 +6.1 23.9 +7.3 23.3 0.0 20.4 12.9 493 (20.5) 37/00
TATURA INST SUSTAINABLE AG 39.9 +10.4 21.4 +7.3 -- 0.0 13.2 -- 323 (13.5) 80/13
BENDIGO AIRPORT 37.4 +7.9 20.5 +6.6 -- 0.0 -- -- 395 (16.5) 48/12
MELBOURNE REGIONAL OFFICE 34.1 +8.2 20.3 +6.0 18.7 0.0 14.8 -- 212 ( 8.8) 32/07
GEELONG AIRPORT 27.9 +3.3 21.0 +7.9 -- 0.0 -- -- 524 (21.8) 54/04
BALLARAT AERODROME 33.7 +8.7 19.5 +8.7 -- 0.0 -- -- 712 (29.7) 52/03
LAUNCESTON (TI TREE BEND) 29.3 +5.1 11.9 -0.2 -- 0.0 -- -- 210 ( 8.8) 48/13
HOBART AIRPORT 32.2 +9.7 14.8 +2.8 11.4 0.0 5.8 12.5 -- 63/09
Max
° C
+/- norm
° C
Min
° C
+/- norm
° C
Grass Min
° C
Rain to 9am mm Evaporation to 9am mm Sunshine hours Wind Run to 9am km Maximum Gust km/h / hour of occurrence
Hottest
Highest maximum temperature>Greatest variation above normal maximum Highest minimum temperatureGreatest variation above normal minimum

46.0 IVANHOE POST OFFICE Southwest Plains NSW
45.6 WILCANNIA (REID ST) Far Northwest NSW
45.0 MARBLE BAR E Pilbara WA
45.0 MARLA POLICE STATION NW Pastoral SA
44.8 ROEBOURNE AERO E Pilbara WA

+15.5 : 41.2 BAIRNSDALE AIRPORT W Gippsland VIC
+15.0 : 40.2 COMBIENBAR AWS E Gippsland VIC
+13.7 : 40.0 MORWELL (LATROBE VALLEY AIRPORT) W Gippsland VIC
+12.7 : 35.0 SWANSEA POST OFFICE E Coast TAS
+12.5 : 36.3 GELANTIPY E Gippsland VIC
+12.5 : 38.0 BOMBALA (THERRY STREET) Goulburn/Monaro NSW

32.0 ARKAROOLA NE Pastoral SA
30.1 BIRDSVILLE AIRPORT Channel Country QLD
29.9 OODNADATTA AIRPORT NE Pastoral SA
29.8 BOULIA AIRPORT Channel Country QLD
29.4 WITTENOOM W Pilbara WA

+13.7 : 27.8 MOORABBIN AIRPORT E Central VIC
+12.7 : 26.3 MELBOURNE AIRPORT E Central VIC
+12.0 : 32.0 ARKAROOLA NE Pastoral SA
+10.6 : 23.9 ESSENDON AIRPORT E Central VIC
+10.1 : 23.3 SCORESBY RESEARCH INSTITUTE E Central VIC

Coldest
Lowest maximum temperatureGreatest variation below normal maximum Lowest minimum temperatureGreatest variation below normal minimum

15.5 MOUNT READ W Coast TAS
16.3 MAATSUYKER ISLAND LIGHTHOUSE Southeast TAS
19.6 CAPE GRIM BAPS N Coast TAS
19.8 KING ISLAND AIRPORT King Island TAS
19.9 STRAHAN AERODROME W Coast TAS

-8.7 : 24.0 GOSNELLS CITY Lower West WA
-8.4 : 22.0 BICKLEY Lower West WA
-8.4 : 22.2 KARNET Lower West WA
-8.0 : 29.6 ELLIOTT N Plateau NT
-7.8 : 25.3 PEARCE RAAF Lower West WA

5.9 THREDBO VILLAGE Snowy Mtns NSW
6.6 COLLIE EAST Lower West WA
7.1 COOMA VISITORS CENTRE Goulburn/Monaro NSW
7.5 WANDERING Cent Wheatbelt WA
7.8 BOMBALA (THERRY STREET) Goulburn/Monaro NSW

-6.4 : 10.0 NAROOMA RVCP South Coast NSW
-6.3 : 7.5 WANDERING Cent Wheatbelt WA
-6.2 : 10.0 YORK Cent Wheatbelt WA
-6.0 : 9.4 BROOKTON Cent Wheatbelt WA
-5.8 : 9.6 PINGELLY Cent Wheatbelt WA

Wettest
Sunniest & dullest
Windiest
Highest gusts
Todays highest rainfall totals for the 24 hours to 9am. It includes the top 5 totals nationally followed by all reported falls of 50mm or more.
Highest and lowest recordings of hours of sunshine for the 24 hours to midnight.
Highest wind run totals in kilometres for the 24 hours to 9am (average speed in brackets). All reported runs > =25km/h are shown.
Highest wind gusts in km/h for the 24 hours to midnight followed by the hour in which it occurred. All stations with gusts > 89km/h are shown.
138.0 THE PINES N Rivers NT
132.0 KIMBERLEY COASTAL CAMP N Kimberley WA
82.0 NEWCASTLE WATERS N Plateau NT
74.5 RENNER SPRINGS N Plateau NT
72.0 DUNBAR STATION Gulf Country QLD

WESTERN AUSTRALIA
N Kimberley
132.0 KIMBERLEY COASTAL CAMP
58.0 THEDA
53.0 KALUMBURU
E Kimberley
50.2 KACHANA

NORTHERN TERRITORY
N Rivers
138.0 THE PINES
69.8 NUTWOOD DOWNS
68.8 UPPER VICTORIA RIVER
64.6 SUNSHINE BORE
61.0 BIRRINDUDU
59.0 WEST WATERHOUSE
56.0 LAJAMANU
54.0 FORT HILL WHARF
52.2 KATHERINE COUNCIL
50.6 NGAYAWILI
N Plateau
82.0 NEWCASTLE WATERS
74.5 RENNER SPRINGS
70.4 WAUCHOPE
53.0 ELLIOTT

QUEENSLAND
Gulf Country
72.0 DUNBAR STATION
63.4 LANDS END STATION
59.0 WERRINA STATION
Upper Carpentaria
61.4 MOUNT SURPRISE TOWNSHIP
52.0 IRON HURST STATION
Central West
63.0 CAMERON DOWNS

13.6 ADELAIDE AIRPORT Adelaide/Lofty SA
13.6 MOUNT GAMBIER AERO Lower SE SA
13.5 CEDUNA AMO W Agricultural SA
13.4 ORANGE AGRICULTURAL INSTITUTE C Tablelands S NSW
13.4 LIAWENEE Central Plateau TAS

.....

4.0 CAIRNS AERO N Coast--Barron QLD
3.5 DARWIN AIRPORT N Rivers NT
2.4 TENNANT CREEK AIRPORT N Plateau NT
2.2 LARRIMAH N Rivers NT
1.5 ALICE SPRINGS AIRPORT N Plateau NT

1339 (55.8) TASMAN ISLAND Southeast TAS
1299 (54.1) CAPE GRIM BAPS N Coast TAS
1144 (47.7) MOUNT READ W Coast TAS
985 (41.0) COLAC (MT GELLIBRAND) W Coast VIC
976 (40.7) MOUNT WELLINGTON Southeast TAS
960 (40.0) SMITHTON AERODROME N Coast TAS
958 (39.9) WILSONS PROMONTORY LIGHTHOUSE W Gippsland VIC
957 (39.9) VARANUS ISLAND Islands ISL
957 (39.9) HOGAN ISLAND Islands ISL
854 (35.6) BARROW ISLAND AIRPORT W Pilbara WA
840 (35.0) FLINDERS ISLAND AIRPORT Flinders Is/Bass St TAS
799 (33.3) CAPE LEEUWIN Lower West WA
782 (32.6) CARNARVON AIRPORT W Gascoyne WA
782 (32.6) MELBOURNE AIRPORT E Central VIC
767 (32.0) THEVENARD ISLAND W Pilbara WA
761 (31.7) KILMORE GAP N Central VIC
760 (31.7) PORT AUGUSTA AERO W Agricultural SA
757 (31.5) STRAHAN AERODROME W Coast TAS
732 (30.5) THREDBO AWS Snowy Mtns NSW
732 (30.5) FRIENDLY BEACHES E Coast TAS
714 (29.8) CAPE WILLOUGHBY Yorke Pen/Kanga Is SA
712 (29.7) BALLARAT AERODROME Western Plains VIC
706 (29.4) KING ISLAND AIRPORT King Island TAS
705 (29.4) LEARMONTH AIRPORT W Pilbara WA
700 (29.2) HINDMARSH ISLAND AWS Adelaide/Lofty SA
697 (29.0) WOOMERA AERODROME NW Pastoral SA
670 (27.9) MT HOTHAM Upper NE VIC
669 (27.9) KARRATHA AERO E Pilbara WA
652 (27.2) DUNNS HILL E Central VIC
637 (26.5) ROTTNEST ISLAND Lower West WA
634 (26.4) WHYALLA AERO W Agricultural SA
630 (26.3) YUNTA AIRSTRIP Northeast SA
629 (26.2) SNOWTOWN (RAYVILLE PARK) Lower North SA
629 (26.2) MONTAGUE ISLAND LIGHTHOUSE South Coast NSW
627 (26.1) TOOWOOMBA AIRPORT Darling Downs E QLD
623 (26.0) ONSLOW AIRPORT W Pilbara WA
616 (25.7) NEPTUNE ISLAND W Agricultural SA
616 (25.7) GREEN CAPE AWS South Coast NSW
609 (25.4) ROSEWORTHY AG COLLEGE Adelaide/Lofty SA
608 (25.3) LOW HEAD N Coast TAS
607 (25.3) EDITHBURGH Yorke Pen/Kanga Is SA
120/05 MOUNT WELLINGTON Southeast TAS
106/05 MOUNT READ W Coast TAS
100/04 TASMAN ISLAND Southeast TAS
97/07 MAATSUYKER ISLAND LIGHTHOUSE Southeast TAS
91/00 CAPE GRIM BAPS N Coast TAS

Downpours High AWS wind reports
High rainfall for periods of 6 hours or less from AWS and synoptic reports. Storm force gusts (>89km/h) and 10-minute mean gales (>62km/h) reported by AWSs. Wind direction and mean windspeed are shown in brackets.
WESTERN AUSTRALIA
N Kimberley
TROUGHTON ISLAND
11.8mm in 1 hr to 20:00 11.8mm/h
W Kimberley
FITZROY CROSSING AERO
10.0mm in 12 min to 11:28 50.0mm/h
13.8mm in 29 min to 11:57 28.6mm/h
30.0mm in 3 hr to 12:00 10.0mm/h
WEST ROEBUCK
22.0mm in 29 min to 18:30 45.5mm/h
22.0mm in 1 hr to 18:30 22.0mm/h
24.0mm in 3 hr to 21:00 8.0mm/h
NORTHERN TERRITORY
N Rivers
DARWIN AIRPORT
7.2mm in 14 min to 18:49 30.9mm/h
15.2mm in 1 hr to 19:00 15.2mm/h
16.0mm in 3 hr to 21:30 5.3mm/h
CAPE DON
16.0mm in 3 hr to 06:30 5.3mm/h
BATCHELOR AERO
28.8mm in 1 hr to 15:30 28.8mm/h
17.0mm in 3 hr to 15:30 5.7mm/h
15.0mm in 3 hr to 18:30 5.0mm/h
LAJAMANU
34.0mm in 3 hr to 00:00 11.3mm/h
21.6mm in 1 hr to 00:30 21.6mm/h
17.0mm in 3 hr to 03:00 5.7mm/h
31.6mm in 1 hr to 18:30 31.6mm/h
31.0mm in 3 hr to 21:00 10.3mm/h
PORT KEATS AERO
22.6mm in 2 hr to 02:30 11.3mm/h
26.0mm in 3 hr to 03:30 8.7mm/h
QUEENSLAND
N Peninsula
COCONUT ISLAND
18.0mm in 3 hr to 09:00 6.0mm/h
16.0mm in 3 hr to 15:00 5.3mm/h
Gulf Country
MOUNT ISA AERO
8.2mm in 8 min to 14:43 61.5mm/h
13.6mm in 1 hr to 15:00 13.6mm/h
11.4mm in 32 min to 16:32 21.4mm/h
12.4mm in 1 hr to 17:00 12.4mm/h
15.0mm in 3 hr to 18:00 5.0mm/h
Upper Carpentaria
HUGHENDEN AIRPORT
11.0mm in 42 min to 14:00 15.7mm/h
11.4mm in 1 hr to 14:00 11.4mm/h
RICHMOND AIRPORT
5.4mm in 32 min to 17:32 10.1mm/h
7.6mm in 15 min to 17:47 30.4mm/h
12.8mm in 13 min to 18:00 59.1mm/h
25.8mm in 1 hr to 18:00 25.8mm/h
26.0mm in 3 hr to 18:00 8.7mm/h
22.2mm in 16 min to 18:21 83.2mm/h
8.4mm in 17 min to 18:38 29.6mm/h
39.4mm in 1 hr to 19:00 39.4mm/h
49.0mm in 3 hr to 21:00 16.3mm/h
Northwest
CAMOOWEAL TOWNSHIP
11.0mm in 7 min to 15:33 94.3mm/h
7.2mm in 3 min to 15:36 144.0mm/h
19.0mm in 9 min to 15:45 126.7mm/h
13.2mm in 15 min to 16:00 52.8mm/h
55.0mm in 3 hr to 18:00 18.3mm/h
THE MONUMENT AIRPORT
6.4mm in 16 min to 14:35 24.0mm/h
WINTON AIRPORT
13.2mm in 20 min to 21:00 39.6mm/h
13.2mm in 1 hr to 21:00 13.2mm/h
8.8mm in 37 min to 21:37 14.3mm/h
WINTON POST OFFICE
38.0mm in 6 hr to 21:00 6.3mm/h

VICTORIA
Wimmera S
GRAMPIANS (MOUNT WILLIAM) : 96( 10/ 59 ) at 01:30
W Gippsland
WILSONS PROMONTORY LIGHTHOUSE : 76(270/ 63 ) at 12:30
W Coast
COLAC (MT GELLIBRAND) : 78(360/ 65 ) at 04:00
TASMANIA
N Coast
CAPE GRIM BAPS : 87(100/ 69 ) at 01:00
E Coast
MARIA ISLAND (POINT LESUEUR) : 91(170/ 63 ) at 14:17
Southeast
MAATSUYKER ISLAND LIGHTHOUSE : 96(330/ 76 ) at 09:00
MOUNT WELLINGTON : 121(340/ 87 ) at 07:00
TASMAN ISLAND : 100(360/ 61 ) at 05:16
W Coast
MOUNT READ : 102( 10/ 76 ) at 05:00