Monday 15 JAN 2007
 

Home page

DWS ARCHIVE
2024 2023 2022 2021 2020 2019 2018 2017 2016 2015 2014 2013 2012 2011 2010 2009 2008 2007 2006 2005 2004 2003
Before 2003

About the DWS


2007

Dec

M Tu W Th F Sa Su
          01 02
03 04 05 06 07 08 09
10 11 12 13 14 15 16
17 18 19 20 21 22 23
24 25 26 27 28 29 30
31            

Nov

M Tu W Th F Sa Su
      01 02 03 04
05 06 07 08 09 10 11
12 13 14 15 16 17 18
19 20 21 22 23 24 25
26 27 28 29 30    

Oct

M Tu W Th F Sa Su
01 02 03 04 05 06 07
08 09 10 11 12 13 14
15 16 17 18 19 20 21
22 23 24 25 26 27 28
29 30 31        

Sept

M Tu W Th F Sa Su
          01 02
03 04 05 06 07 08 09
10 11 12 13 14 15 16
17 18 19 20 21 22 23
24 25 26 27 28 29 30

August

M Tu W Th F Sa Su
    01 02 03 04 05
06 07 08 09 10 11 12
13 14 15 16 17 18 19
20 21 22 23 24 25 26
27 28 29 30 31    

July

M Tu W Th F Sa Su
            01
02 03 04 05 06 07 08
09 10 11 12 13 14 15
16 17 18 19 20 21 22
23 24 25 26 27 28 29
30 31          

June

M Tu W Th F Sa Su
        01 02 03
04 05 06 07 08 09 10
11 12 13 14 15 16 17
18 19 20 21 22 23 24
25 26 27 28 29 30  

May

M Tu W Th F Sa Su
  01 02 03 04 05 06
07 08 09 10 11 12 13
14 15 16 17 18 19 20
21 22 23 24 25 26 27
28 29 30 31      

April

M Tu W Th F Sa Su
            01
02 03 04 05 06 07 08
09 10 11 12 13 14 15
16 17 18 19 20 21 22
23 24 25 26 27 28 29
30            

March

M Tu W Th F Sa Su
      01 02 03 04
05 06 07 08 09 10 11
12 13 14 15 16 17 18
19 20 21 22 23 24 25
26 27 28 29 30 31  

February

M Tu W Th F Sa Su
      01 02 03 04
05 06 07 08 09 10 11
12 13 14 15 16 17 18
19 20 21 22 23 24 25
26 27 28        

January

M Tu W Th F Sa Su
01 02 03 04 05 06 07
08 09 10 11 12 13 14
15 16 17 18 19 20 21
22 23 24 25 26 27 28
29 30 31        

Monthly summaries:
from BoM

Find a place:
Google Maps |
Aust Gazetteer|
Geonames

Weather terms:
WeatherZone | BoM |
American Met Soc | NOAA | uk.sci.weather | India Meteorological Department

National Daily Weather Summary

Records set | Charts | Cities | Hottest | Coldest | Rain, sun & wind | Downpours & gales
State extremes | Noteworthy weather | Capital Cities | Regional Cities | Alpine Stations
Charts and data courtesy Bureau of Meteorology. MTSAT-1R operated by JMA
Noteworthy weather today
significant newsworthy major

NSW, VIC: Bushfire concerns continue. Lightning strikes from mostly dry thunderstorms caused fresh concerns in northern NSW today, with a new fire 15km N of Mendooran burning through 10sq km and another in Pilliga State Forest 45km SW of Narrabri burning through 18sq km. The Goonoo forest fire north of Dubbo and west of the separate Mendooran blaze had burnt through 190sq km as it extended its boundaries to the west, north and east. Firefighters commented on the exceptional dryness of the forest, which has seen little rain in the past 8 months, and is encouraging erratic fire behaviour.

In VIC, cooler weather helped firefighters' containment activities, but the Tolmie fire, which headed south today threatening Toombullup, Archerton and Tolmie, broke through containment lines during the afternoon. The fire near Tom Groggin, between Corryong VIC and Thredbo NSW, jumped the Murray River from VIC into NSW today. The Great Divide southern section fire continued moving slowly east and south towards Ensay, Brookville and Bruthen.

WA: Records fall for heat in the south, cold in the north. WA was a state of extremes in temperature today, with parts of the south nearly 20C hotter than parts of the normally torrid inland northern deserts. The day began with overnight minimum temperatures in the Great Southern, Central Wheatbelt and Goldfields 6 to 10 above average. Ravensthorpe reported a low of 27.0, 13.1 above the norm. Although well above nearby stations, it seems plausible given a 9am temperature of 33C in a fresh NW wind and nearby minimum temperature reports of 23.2 at Newdegate (also a record) and 24.5 at Hyden (January record 26.3).

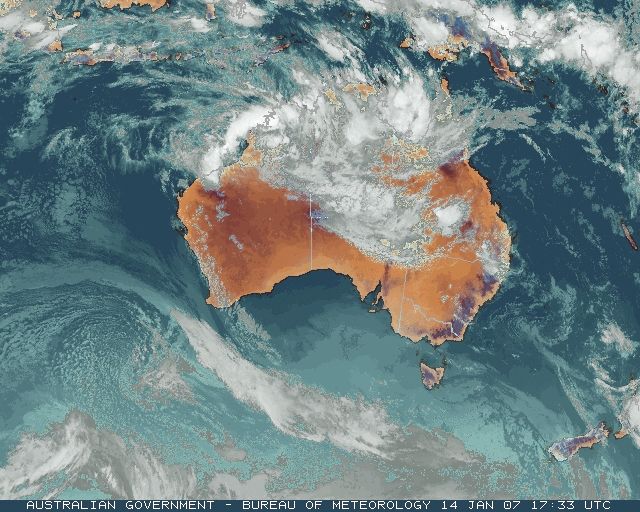
The maximum temperature anomaly chart shows that while top temperatures in SE WA were reaching 8 to 14 above average (42.6 at Norseman was the highest), an area of the Great Sandy Desert in NE WA and the neighbouring Tanami Desert in NT was experiencing highs 10 to 14 below. With heavy monsoonal cloud cover and rain, places like Balgo Hills, Halls Creek, Yuendumu and Yulara barely made the mid-20s. Balgo Hills' top of 24.6 was 2.5C lower than the previous coldest January day in 20 years. The map of actual maximum temperatures shows the dramatic reversal in the ordinary temperature distrubution.

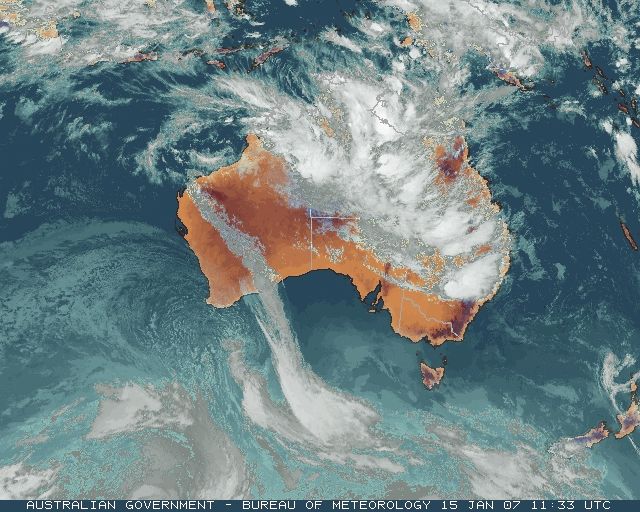
WA, NT, QLD: Monsoon rains continue. The monsoon low in the southern Kimberley region of WA moved very slowly south, drawing the monsoon trough with it deeper into WA and the NT. The heavy rain reported yesterday contracted southeast across the Great Sandy Desert in WA and into the Tanami Desert of western NT. Balgo Hills WA reported 89mm between 9am and 3pm while Rabbit Flat NT recorded 50mm between 9am and 9pm in steady moderate rain. (The average totals for the whole month of January for these two stations are 69.1 and 100.0mm.) From western NT the monsoon trough stretched NE to the tip of Cape York Peninsula QLD, with reports of heavy showers and thunderstorms continuing across the Top End and around the Gulf. See downpours and wettest.


Records set or equalled today

These records are based on data received as at 2343 EST on 20/08/2008. Help in interpreting these statistics and information on quality control is here.

District Site Today Previous monthly record Previous all time record
if equalled or broken
Comments
Reading Reading Date Years Reading Date Years
Highest daily rainfall

NT

Alice Springs

015555

TANAMI DOWNS

147.0

136.5

13/01/2007

36

147.0

11/02/1982

41

1 n Previous record set earlier this month.

Highest minimum temperature

WA

Gt Southern

010633

RAVENSTHORPE

27.0

26.7

03/01/1997

45

1

WA

Gt Southern

010692

NEWDEGATE RES.STATION

23.2

22.8

03/01/1997

11

Y

Lowest maximum temperature

WA

Interior

013007

BALGO HILLS

24.6

27.1

28/01/1991

20

1 Y


The day in charts
Surface charts Satellite images Rain & temperatures
4am EST Rainfall -- 24 hours to 9am
Available about 6am EST Available about 4am EST Available about 2pm EST
Week to 9am | SE AUS detail
10am EST Minimum temperature +/- normal
Available about noon EST Available about 10am EST Available about 2pm EST next day
Actual temperatures
4pm EST Maximum temperature +/- normal
Available about 6pm EST Available about 4pm EST Available about 2pm EST next day
Actual temperatures
10pm EST Solar Radiation
Available about midnight EST Available about 10pm EST Available about 2am EST next day

Summary of observations

For notes on how to interpret the data and quality control issues, see Daily Weather Summary Help.
**S** and **W** precede data flagged by the Bureau as suspicious or wrong
Data is as received at 23:56EST, 14/05/2012.

Major centres
Max
° C
+/- norm
° C
Min
° C
+/- norm
° C
Grass Min
° C
Rain to 9am mm Evaporation to 9am mm Sunshine hours Wind Run to 9am km (24-hour average km/h) Maximum Gust km/h / hour of occurrence
GERALDTON AIRPORT 26.9 -4.7 21.4 +3.1 20.9 0.0 7.0 -- 570 (23.8) 71/17
PERTH AIRPORT 27.1 -4.5 20.3 +3.4 20.7 0.0 14.2 8.0 480 (20.0) 65/17
ALBANY AIRPORT 24.0 -0.7 17.8 +4.1 17.6 0.0 8.4 4.8 344 (14.3) 68/14
BUNBURY 23.3 -6.1 16.8 +1.7 -- 0.0 -- -- 279 (11.6) 54/15
MANDURAH 23.9 -- 19.7 -- -- 0.0 -- -- 418 (17.4) 63/16
DARWIN AIRPORT 32.0 +0.2 26.5 +1.7 25.7 1.6 7.0 4.5 413 (17.2) 48/12
ALICE SPRINGS AIRPORT 27.9 -8.5 18.8 -2.6 18.3 6.2 10.2 0.4 397 (16.5) 44/13
WHYALLA AERO 32.6 +2.7 18.1 +0.7 -- 0.0 8.0 -- 555 (23.1) 35/13
ADELAIDE (KENT TOWN) 35.0 +5.9 17.6 +0.6 11.8 0.0 7.0 13.5 251 (10.5) 30/15
MOUNT GAMBIER AERO 28.7 +3.5 13.0 +1.9 11.6 0.0 6.0 12.7 490 (20.4) 39/14
MOUNT ISA AERO 33.5 -2.8 23.5 -0.3 22.9 0.0 4.0 6.4 243 (10.1) 58/14
CAIRNS AERO 33.5 +2.1 23.6 -0.1 21.3 0.0 6.8 7.6 245 (10.2) 37/07
TOWNSVILLE AERO 32.4 +1.1 24.7 +0.5 22.3 0.0 10.8 11.3 478 (19.9) 48/13
MACKAY M.O 30.9 +0.8 24.6 +1.1 -- 0.0 -- 9.8 366 (15.3) 35/19
ROCKHAMPTON AERO 32.4 +0.5 19.2 -2.9 18.0 0.0 6.8 -- 228 ( 9.5) 35/14
BUNDABERG AERO 30.0 -0.1 20.1 -1.3 -- 0.0 5.6 -- 263 (11.0) --
NAMBOUR DPI 27.9 -1.4 19.5 +0.1 -- 0.0 14.8 -- 80 ( 3.3) 26/12
COOLANGATTA 27.8 -0.3 21.2 +0.2 -- 0.0 -- -- 203 ( 8.5) 31/16
BRISBANE AERO 28.9 -0.1 23.2 +2.1 21.2 0.0 7.6 7.6 318 (13.3) 34/12
TOOWOOMBA AIRPORT 28.4 +0.3 18.4 +0.9 -- 0.0 -- -- 649 (27.0) 52/00
GUNNEDAH RESOURCE CENTRE 36.2 +4.3 19.8 +1.0 14.3 0.0 10.6 -- 281 (11.7) --
COFFS HARBOUR MO 25.3 -1.6 19.5 +0.1 18.5 5.8 3.8 2.2 466 (19.4) 26/00
PORT MACQUARIE AIRPORT AWS 27.1 -0.3 16.1 -2.0 -- 0.2 -- -- -- --
WILLIAMTOWN RAAF 26.7 -1.2 13.6 -4.4 11.2 0.0 5.4 11.9 269 (11.2) 45/13
GOSFORD (NARARA RESEARCH STATION) AWS 26.9 -0.6 13.4 -3.3 -- 0.0 -- -- 99 ( 4.1) 45/09
ORANGE AGRICULTURAL INSTITUTE 31.2 +4.7 12.1 -1.1 8.0 0.0 5.0 10.0 -- --
DUBBO AIRPORT AWS 37.4 +4.3 18.2 +0.1 -- 0.0 -- -- -- --
SYDNEY AIRPORT AMO 25.8 -0.6 18.3 -0.4 12.2 0.0 6.8 13.1 355 (14.8) 45/16
RICHMOND RAAF 30.3 +0.5 14.7 -2.7 -- 0.0 -- -- 166 ( 6.9) 39/16
BELLAMBI AWS 25.4 +0.6 17.4 -1.5 -- 0.0 -- -- 123 ( 5.1) 21/22
CANBERRA AIRPORT 33.2 +5.2 12.8 -0.4 10.3 0.0 8.8 13.0 326 (13.6) 45/19
WAGGA WAGGA AMO 37.9 +6.3 21.3 +5.1 20.4 0.0 11.8 13.2 394 (16.4) 46/02
ALBURY AIRPORT AWS 38.0 +5.8 17.9 +1.3 -- 0.0 -- -- 146 ( 6.1) 31/23
MILDURA AIRPORT 37.2 +5.0 18.6 +2.0 17.1 0.0 11.2 13.0 350 (14.6) 32/09
TATURA INST SUSTAINABLE AG 36.6 +7.1 15.2 +1.1 -- 0.0 32.0 -- 399 (16.6) 34/23
BENDIGO AIRPORT 35.5 +6.0 14.8 +0.9 -- 0.0 -- -- 436 (18.2) 32/23
MELBOURNE REGIONAL OFFICE 24.2 -1.7 16.4 +2.1 16.9 0.0 4.8 -- 168 ( 7.0) 22/11
GEELONG AIRPORT 20.8 -3.8 15.0 +1.9 -- 0.0 -- -- 401 (16.7) 37/17
BALLARAT AERODROME 29.9 +4.9 11.5 +0.7 -- 0.0 -- -- 635 (26.5) 46/18
LAUNCESTON (TI TREE BEND) 27.5 +3.3 12.5 +0.4 -- 0.0 -- -- 218 ( 9.1) 41/16
HOBART AIRPORT 20.9 -1.6 11.6 -0.4 8.8 0.0 6.6 10.7 345 (14.4) 46/15
Max
° C
+/- norm
° C
Min
° C
+/- norm
° C
Grass Min
° C
Rain to 9am mm Evaporation to 9am mm Sunshine hours Wind Run to 9am km Maximum Gust km/h / hour of occurrence
Hottest
Highest maximum temperature>Greatest variation above normal maximum Highest minimum temperatureGreatest variation above normal minimum

43.0 IVANHOE POST OFFICE Southwest Plains NSW
43.0 BOURKE AIRPORT AWS Upper Darling NSW
43.0 EMU CREEK STATION W Gascoyne WA
42.6 NORSEMAN AERO Goldfields WA

+13.5 : 39.8 EYRE Eucla WA
+12.9 : 39.0 ESPERANCE Lower West WA
+11.4 : 38.8 ESPERANCE AERO Lower West WA
+10.8 : 42.0 BALLADONIA Eucla WA
+10.7 : 41.1 SALMON GUMS RES.STN. Goldfields WA

29.3 KARRATHA AERO E Pilbara WA
28.5 PARDOO STATION E Pilbara WA
28.2 QUILPIE AIRPORT Far SW QLD
28.1 BLACK POINT N Rivers NT
28.1 BIRDSVILLE AIRPORT Channel Country QLD

+13.0 : 27.0 RAVENSTHORPE Cent Wheatbelt WA
+9.5 : 23.2 NEWDEGATE RES.STATION Cent Wheatbelt WA
+9.1 : 24.5 HYDEN Cent Wheatbelt WA
+8.6 : 23.6 LAKE GRACE Cent Wheatbelt WA
+8.5 : 23.3 LAKE GRACE COMPARISON Cent Wheatbelt WA

Coldest
Lowest maximum temperatureGreatest variation below normal maximum Lowest minimum temperatureGreatest variation below normal minimum

17.0 MAATSUYKER ISLAND LIGHTHOUSE Southeast TAS
17.7 TASMAN ISLAND Southeast TAS
18.0 WILSONS PROMONTORY LIGHTHOUSE W Gippsland VIC
18.0 MOUNT WELLINGTON Southeast TAS
18.6 AIREYS INLET W Coast VIC
18.6 CAPE BRUNY LIGHTHOUSE Southeast TAS

-14.1 : 24.6 BALGO HILLS Interior WA
-12.3 : 24.1 YUENDUMU N Plateau NT
-12.1 : 26.5 YULARA AERO N Plateau NT
-11.5 : 25.3 HALLS CREEK AIRPORT E Kimberley WA
-10.8 : 27.6 WATARRKA N Plateau NT

3.7 LIAWENEE Central Plateau TAS
5.2 LAKE ST CLAIR NATIONAL PARK Central Plateau TAS
6.0 THREDBO VILLAGE Snowy Mtns NSW
6.0 TARRALEAH VILLAGE Derwent Valley TAS

-6.9 : 15.6 YUENDUMU N Plateau NT
-6.3 : 16.5 WILUNA Interior WA
-6.2 : 7.1 FLINDERS ISLAND AIRPORT Flinders Is/Bass St TAS
-5.6 : 19.6 BALGO HILLS Interior WA
-4.8 : 10.8 MALLACOOTA E Gippsland VIC

Wettest
Sunniest & dullest
Windiest
Highest gusts
Todays highest rainfall totals for the 24 hours to 9am. It includes the top 5 totals nationally followed by all reported falls of 50mm or more.
Highest and lowest recordings of hours of sunshine for the 24 hours to midnight.
Highest wind run totals in kilometres for the 24 hours to 9am (average speed in brackets). All reported runs > =25km/h are shown.
Highest wind gusts in km/h for the 24 hours to midnight followed by the hour in which it occurred. All stations with gusts > 89km/h are shown.
197.4 KURI BAY N Kimberley WA
147.0 TANAMI DOWNS N Plateau NT
110.0 THEDA N Kimberley WA
103.0 FOSSIL DOWNS W Kimberley WA
98.0 KIMBERLEY COASTAL CAMP N Kimberley WA

WESTERN AUSTRALIA
N Kimberley
197.4 KURI BAY
110.0 THEDA
98.0 KIMBERLEY COASTAL CAMP
E Kimberley
89.2 MOUNT KRAUSS
66.6 MORNINGTON
65.2 MOUNT WINIFRED
64.3 WARMUN
57.6 MORNINGTON AIRSTRIP
55.0 SOPHIE DOWNS
W Kimberley
103.0 FOSSIL DOWNS
90.2 LEOPOLD DOWNS
78.2 COUNTRY DOWNS
77.0 MOUNT HART STATION
74.4 MOUNT HOUSE AIRSTRIP
61.7 CHARNLEY RIVER
53.8 BROOKING SPRINGS
52.0 MOUNT HOUSE STATION
51.4 CYGNET BAY

NORTHERN TERRITORY
N Rivers
84.0 MALLAPUNYAH
55.8 NGAYAWILI
53.6 CALVERT HILLS
N Plateau
147.0 TANAMI DOWNS

QUEENSLAND
N Peninsula
73.0 MORETON TELEGRAPH STATION
54.0 BRAMWELL
Gulf Country
54.0 KARUMBA AIRPORT
Upper Carpentaria
53.6 MOUNT SURPRISE TOWNSHIP
Channel Country
54.4 ROXBOROUGH DOWNS
Warrego
61.0 SHERWOOD PARK STATION

13.9 ADELAIDE AIRPORT Adelaide/Lofty SA
13.5 ADELAIDE (KENT TOWN) Adelaide/Lofty SA
13.5 SCOTTSDALE (WEST MINSTONE ROAD) N Coast TAS
13.4 CEDUNA AMO W Agricultural SA
13.4 NURIOOTPA VITICULTURAL Adelaide/Lofty SA

.....

3.7 ALSTONVILLE TROPICAL FRUIT RESEARCH STAT North Coast NSW
2.2 COFFS HARBOUR MO MidNorth Coast N NSW
0.4 ALICE SPRINGS AIRPORT N Plateau NT
0.1 WEIPA AERO N Peninsula QLD
0.0 RABBIT FLAT N Plateau NT

1087 (45.3) MAATSUYKER ISLAND LIGHTHOUSE Southeast TAS
884 (36.8) CAPE GRIM BAPS N Coast TAS
772 (32.2) CARNARVON AIRPORT W Gascoyne WA
690 (28.8) ROTTNEST ISLAND Lower West WA
689 (28.7) LEARMONTH AIRPORT W Pilbara WA
688 (28.7) CAPE NATURALISTE Lower West WA
683 (28.5) NORTH ISLAND Central West WA
681 (28.4) KILMORE GAP N Central VIC
678 (28.3) HOGAN ISLAND Islands ISL
673 (28.0) CAPE JAFFA (CURLEY HILLS) Lower SE SA
664 (27.7) SHARK BAY AIRPORT W Gascoyne WA
656 (27.3) PARAWA (SECOND VALLEY FOREST AWS) Adelaide/Lofty SA
653 (27.2) HAMILTON ISLAND AIRPORT Central Coast E QLD
649 (27.0) TOOWOOMBA AIRPORT Darling Downs E QLD
646 (26.9) MINLATON AERO Yorke Pen/Kanga Is SA
640 (26.7) ONSLOW AIRPORT W Pilbara WA
637 (26.5) MCCLUER ISLAND N Rivers NT
635 (26.5) BALLARAT AERODROME Western Plains VIC
634 (26.4) LOW HEAD N Coast TAS
631 (26.3) EDITHBURGH Yorke Pen/Kanga Is SA
628 (26.2) THEVENARD ISLAND W Pilbara WA
621 (25.9) WILLIS ISLAND Islands ISL
620 (25.8) CAPE WILLOUGHBY Yorke Pen/Kanga Is SA
608 (25.3) MURRURUNDI GAP AWS Hunter Valley NSW
87/15 NORSEMAN AERO Goldfields WA
76/17 HOPETOUN NORTH Lower West WA
74/14 ROTTNEST ISLAND Lower West WA
72/19 MARDIE W Pilbara WA
72/15 SHARK BAY AIRPORT W Gascoyne WA
72/13 SALMON GUMS RES.STN. Goldfields WA
72/15 COBAR AIRPORT AWS Upper Darling NSW

Downpours High AWS wind reports
High rainfall for periods of 6 hours or less from AWS and synoptic reports. Storm force gusts (>89km/h) and 10-minute mean gales (>62km/h) reported by AWSs. Wind direction and mean windspeed are shown in brackets.
WESTERN AUSTRALIA
E Kimberley
HALLS CREEK AIRPORT
10.6mm in 1 hr to 21:30 10.6mm/h
ARGYLE AERODROME
13.6mm in 26 min to 16:30 31.4mm/h
13.6mm in 1 hr to 16:30 13.6mm/h
E Pilbara
PORT HEDLAND AIRPORT
6.0mm in 17 min to 02:52 21.2mm/h
Interior
BALGO HILLS
89.0mm in 6 hr to 15:00 14.8mm/h
NORTHERN TERRITORY
N Rivers
CAPE DON
10.4mm in 55 min to 16:30 11.3mm/h
10.4mm in 1 hr to 16:30 10.4mm/h
DUM IN MIRRIE AWS
11.8mm in 1 hr to 10:30 11.8mm/h
22.0mm in 3 hr to 12:30 7.3mm/h
WARRUWI
12.2mm in 1 hr to 01:30 12.2mm/h
12.0mm in 1 hr to 02:30 12.0mm/h
25.0mm in 3 hr to 03:30 8.3mm/h
MILINGIMBI AWS
12.8mm in 1 hr to 12:30 12.8mm/h
17.0mm in 3 hr to 12:30 5.7mm/h
MANINGRIDA AERO
11.0mm in 1 hr to 10:30 11.0mm/h
11.4mm in 1 hr to 23:30 11.4mm/h
NGAYAWILI
20.0mm in 3 hr to 06:30 6.7mm/h
26.0mm in 3 hr to 09:30 8.7mm/h
23.0mm in 3 hr to 12:30 7.7mm/h
N Plateau
RABBIT FLAT
17.0mm in 3 hr to 12:30 5.7mm/h
16.0mm in 3 hr to 18:30 5.3mm/h
QUEENSLAND
N Peninsula
SCHERGER RAAF
30.8mm in 40 min to 15:00 46.2mm/h
31.0mm in 1 hr to 15:00 31.0mm/h
31.0mm in 3 hr to 15:00 10.3mm/h
31.4mm in 1 hr to 16:00 31.4mm/h
41.0mm in 3 hr to 18:00 13.7mm/h
Gulf Country
MORNINGTON ISLAND
20.0mm in 30 min to 05:30 40.0mm/h
25.0mm in 1 hr to 05:30 25.0mm/h
27.4mm in 1 hr to 06:00 27.4mm/h
33.0mm in 3 hr to 06:00 11.0mm/h
12.8mm in 1 hr to 06:30 12.8mm/h
CENTURY MINE
18.8mm in 30 min to 16:30 37.6mm/h
22.6mm in 1 hr to 16:30 22.6mm/h
22.8mm in 1 hr to 17:00 22.8mm/h
30.0mm in 3 hr to 18:00 10.0mm/h
Northwest
THE MONUMENT AIRPORT
10.8mm in 1 hr to 19:00 10.8mm/h
NEW SOUTH WALES
NW Slopes S
TAMWORTH AIRPORT AWS
4.2mm in 11 min to 18:45 22.9mm/h
11.4mm in 1 hr to 19:00 11.4mm/h
None reported