|
For notes on how to interpret
the data and quality control issues, see Daily Weather Summary Help.
**S** and **W** precede data flagged by the Bureau as suspicious or wrong
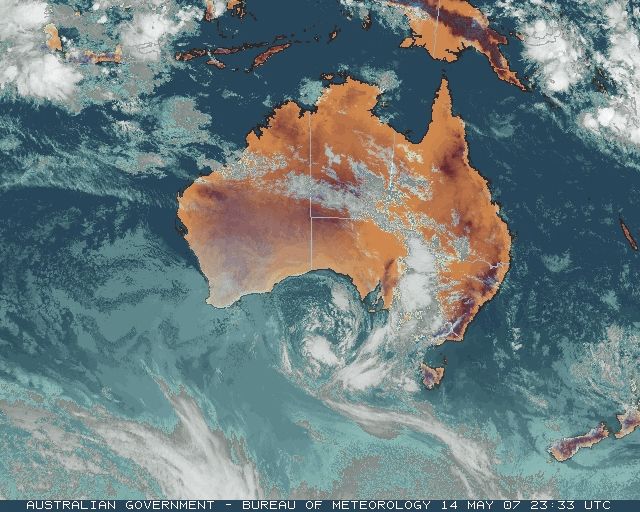
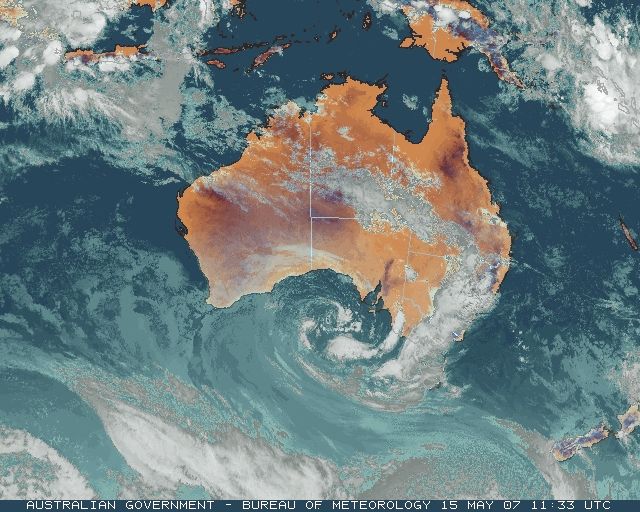
Data is as received at 00:35EST, 15/05/2012.
|
|
| |
Max
°
C |
+/- norm
°
C |
Min
°
C |
+/- norm
°
C |
Grass Min
°
C |
Rain to 9am mm |
Evaporation to 9am mm |
Sunshine hours |
Wind Run to 9am km (24-hour average km/h) |
Maximum Gust km/h / hour of occurrence |
| GERALDTON AIRPORT |
22.1 |
-1.9 |
7.2 |
-5.7 |
5.5 |
0.0 |
8.8 |
-- |
486 (20.3) |
41/14 |
| PERTH AIRPORT |
19.7 |
-2.0 |
2.7 |
-7.8 |
1.1 |
0.0 |
3.0 |
8.5 |
234 ( 9.8) |
30/15 |
| ALBANY AIRPORT |
16.3 |
-2.6 |
12.0 |
+2.2 |
10.0 |
0.4 |
2.0 |
0.2 |
328 (13.7) |
43/11 |
| BUNBURY |
18.7 |
-2.4 |
6.0 |
-3.5 |
-- |
0.0 |
-- |
-- |
163 ( 6.8) |
28/14 |
| MANDURAH |
18.9 |
-- |
10.2 |
-- |
-- |
0.0 |
-- |
-- |
237 ( 9.9) |
34/17 |
| DARWIN AIRPORT |
32.8 |
+0.8 |
24.8 |
+2.7 |
24.3 |
0.0 |
6.8 |
11.0 |
360 (15.0) |
39/13 |
| ALICE SPRINGS AIRPORT |
27.5 |
+4.5 |
17.5 |
+9.2 |
16.0 |
0.0 |
5.4 |
5.0 |
232 ( 9.7) |
41/17 |
| WHYALLA AERO |
23.6 |
+3.1 |
14.1 |
+5.4 |
-- |
0.0 |
8.0 |
-- |
433 (18.0) |
50/15 |
| ADELAIDE (KENT TOWN) |
21.2 |
+2.2 |
14.0 |
+3.8 |
12.2 |
4.2 |
1.4 |
5.7 |
227 ( 9.5) |
35/15 |
| MOUNT GAMBIER AERO |
18.4 |
+2.3 |
14.9 |
+7.6 |
13.5 |
1.8 |
2.6 |
2.2 |
430 (17.9) |
37/10 |
| MOUNT ISA AERO |
33.2 |
+5.3 |
22.1 |
+8.2 |
20.4 |
0.0 |
5.4 |
4.8 |
201 ( 8.4) |
28/12 |
| CAIRNS AERO |
29.1 |
+1.5 |
21.6 |
+1.7 |
20.0 |
0.0 |
5.2 |
9.1 |
502 (20.9) |
37/11 |
| TOWNSVILLE AERO |
28.8 |
+1.2 |
17.2 |
-0.4 |
15.9 |
0.0 |
6.8 |
10.2 |
363 (15.1) |
50/11 |
| MACKAY M.O |
25.5 |
+1.3 |
18.5 |
+1.4 |
-- |
0.0 |
-- |
5.6 |
381 (15.9) |
34/14 |
| ROCKHAMPTON AERO |
27.3 |
+1.3 |
19.4 |
+5.2 |
18.6 |
0.0 |
5.0 |
-- |
306 (12.8) |
26/12 |
| BUNDABERG AERO |
27.0 |
+2.3 |
17.3 |
+3.1 |
-- |
0.0 |
3.2 |
-- |
335 (14.0) |
31/15 |
| NAMBOUR DPI |
24.5 |
+0.8 |
14.0 |
+2.0 |
-- |
0.0 |
2.2 |
-- |
48 ( 2.0) |
21/12 |
| COOLANGATTA |
25.4 |
+2.3 |
15.8 |
+1.5 |
-- |
0.4 |
-- |
-- |
199 ( 8.3) |
28/13 |
| BRISBANE AERO |
25.0 |
+1.4 |
15.1 |
+2.3 |
13.2 |
0.0 |
3.5 |
9.8 |
266 (11.1) |
28/13 |
| TOOWOOMBA AIRPORT |
23.2 |
+3.2 |
14.5 |
+4.5 |
-- |
0.2 |
-- |
-- |
546 (22.8) |
39/00 |
| GUNNEDAH RESOURCE CENTRE |
25.2 |
+4.9 |
11.7 |
+3.0 |
6.9 |
0.0 |
3.0 |
-- |
122 ( 5.1) |
-- |
| COFFS HARBOUR MO |
22.7 |
+1.3 |
14.2 |
+2.5 |
12.5 |
0.2 |
2.4 |
9.1 |
123 ( 5.1) |
18/13 |
| PORT MACQUARIE AIRPORT AWS |
24.0 |
+2.5 |
13.4 |
+2.9 |
-- |
0.2 |
-- |
-- |
-- |
-- |
| WILLIAMTOWN RAAF |
21.7 |
+1.5 |
10.8 |
+0.7 |
9.6 |
0.2 |
0.8 |
4.1 |
166 ( 6.9) |
18/15 |
| GOSFORD (NARARA RESEARCH STATION) AWS |
23.1 |
+2.7 |
9.8 |
+1.5 |
-- |
0.2 |
-- |
-- |
21 ( 0.9) |
13/15 |
| ORANGE AGRICULTURAL INSTITUTE |
19.1 |
+4.9 |
6.5 |
+1.8 |
3.6 |
0.2 |
1.6 |
7.0 |
-- |
-- |
| DUBBO AIRPORT AWS |
25.6 |
+5.6 |
9.8 |
+3.0 |
-- |
0.0 |
-- |
-- |
-- |
-- |
| SYDNEY AIRPORT AMO |
23.9 |
+3.9 |
13.9 |
+3.0 |
10.6 |
0.0 |
2.0 |
9.4 |
281 (11.7) |
26/17 |
| RICHMOND RAAF |
21.4 |
+0.8 |
9.8 |
+1.9 |
-- |
0.2 |
-- |
-- |
36 ( 1.5) |
24/15 |
| BELLAMBI AWS |
22.6 |
+2.9 |
13.8 |
+0.7 |
-- |
0.0 |
-- |
-- |
154 ( 6.4) |
30/17 |
| CANBERRA AIRPORT |
21.5 |
+5.9 |
4.4 |
+1.2 |
1.0 |
0.0 |
1.8 |
9.4 |
95 ( 4.0) |
26/15 |
| WAGGA WAGGA AMO |
23.1 |
+5.8 |
9.5 |
+3.6 |
8.1 |
0.0 |
2.2 |
7.1 |
166 ( 6.9) |
24/10 |
| ALBURY AIRPORT AWS |
20.7 |
+3.0 |
9.2 |
+3.6 |
-- |
0.0 |
-- |
-- |
70 ( 2.9) |
15/10 |
| MILDURA AIRPORT |
19.9 |
+0.9 |
16.0 |
+8.6 |
14.3 |
2.6 |
4.2 |
2.5 |
308 (12.8) |
30/09 |
| TATURA INST SUSTAINABLE AG |
17.2 |
-0.1 |
12.4 |
+6.6 |
-- |
0.0 |
1.9 |
-- |
236 ( 9.8) |
24/07 |
| BENDIGO AIRPORT |
16.2 |
-0.4 |
12.2 |
+7.0 |
-- |
4.2 |
-- |
-- |
243 (10.1) |
�
26/14 |
| MELBOURNE REGIONAL OFFICE |
21.2 |
+4.5 |
14.7 |
+6.1 |
11.9 |
0.6 |
1.4 |
-- |
106 ( 4.4) |
24/11 |
| GEELONG AIRPORT |
19.3 |
+2.2 |
10.6 |
+2.9 |
-- |
0.0 |
-- |
-- |
220 ( 9.2) |
24/19 |
| BALLARAT AERODROME |
15.9 |
+2.3 |
12.8 |
+7.1 |
-- |
2.4 |
-- |
-- |
493 (20.5) |
41/05 |
| LAUNCESTON (TI TREE BEND) |
20.0 |
+4.2 |
4.6 |
-0.5 |
-- |
0.0 |
-- |
-- |
31 ( 1.3) |
21/14 |
| HOBART AIRPORT |
21.3 |
+6.1 |
7.9 |
+1.3 |
4.4 |
0.0 |
2.0 |
8.2 |
252 (10.5) |
26/06 |
| |
Max
°
C |
+/- norm
°
C |
Min
°
C |
+/- norm
°
C |
Grass Min
°
C |
Rain to 9am mm |
Evaporation to 9am mm |
Sunshine hours |
Wind Run to 9am km |
Maximum Gust km/h / hour of occurrence |
|
| Hottest |
| Highest maximum temperature> | Greatest variation above normal maximum |
Highest minimum temperature | Greatest variation above normal minimum |
37.5 FITZROY CROSSING AERO W Kimberley WA
36.2 TIMBER CREEK N Rivers NT
36.2 WYNDHAM AERO N Kimberley WA
35.9 CURTIN AERO W Kimberley WA
35.5 BRADSHAW N Rivers NT
35.5 WARMUN E Kimberley WA
|
+7.8 : 18.9 TARRALEAH VILLAGE Derwent Valley TAS
+7.8 : 22.1 STRAHAN AERODROME W Coast TAS
+7.4 : 18.6 MOOGARA (UXBRIDGE BACK ROAD) Derwent Valley TAS
+7.1 : 12.7 MOUNT WELLINGTON Southeast TAS
+7.1 : 19.6 TUNNACK FIRE STATION Southeast TAS
+7.1 : 13.6 MOUNT READ W Coast TAS
|
29.0 NORTHERN ENDEAVOUR Islands ISL
26.0 TROUGHTON ISLAND N Kimberley WA
25.7 COCONUT ISLAND N Peninsula QLD
25.7 BLACK POINT N Rivers NT
25.2 HORN ISLAND N Peninsula QLD
|
+10.0 : 15.0 HORSHAM AERODROME Wimmera S VIC
+9.8 : 16.7 IVANHOE POST OFFICE Southwest Plains NSW
+9.3 : 22.7 CAMOOWEAL TOWNSHIP Northwest QLD
+9.3 : 24.0 DOONGAN N Kimberley WA
+9.2 : 16.6 WILCANNIA AERODROME AWS Far Northwest NSW
+9.2 : 17.5 ALICE SPRINGS AIRPORT N Plateau NT
|
| Coldest |
| Lowest maximum temperature | Greatest variation below normal maximum |
Lowest minimum temperature | Greatest variation below normal minimum |
7.8 MOUNT BULLER Upper NE VIC
8.1 MT HOTHAM Upper NE VIC
10.4 FALLS CREEK Upper NE VIC
11.0 GRAMPIANS (MOUNT WILLIAM) Wimmera S VIC
11.0 MT BAW BAW W Gippsland VIC
|
-6.0 : 14.3 ESPERANCE AERO Lower West WA
-5.5 : 15.0 ESPERANCE Lower West WA
-5.5 : 14.2 SALMON GUMS RES.STN. Goldfields WA
-5.3 : 17.0 DALWALLINU Central West WA
-5.2 : 16.6 DALWALLINU COMPARISON Central West WA
|
-1.2 LAKE LEAKE (ELIZABETH RIVER) E Coast TAS
-0.8 LIAWENEE Central Plateau TAS
-0.7 SOUTHERN CROSS AIRFIELD Goldfields WA
-0.3 MERREDIN Cent Wheatbelt WA
0.0 THREDBO VILLAGE Snowy Mtns NSW
0.0 PERISHER VALLEY SKI CENTRE Snowy Mtns NSW
0.0 LAKE ST CLAIR NATIONAL PARK Central Plateau TAS
|
-9.2 : -0.3 MERREDIN Cent Wheatbelt WA
-9.0 : 2.9 JURIEN BAY Lower West WA
-8.5 : 0.1 CUNDERDIN AIRFIELD Cent Wheatbelt WA
-8.3 : -0.7 SOUTHERN CROSS AIRFIELD Goldfields WA
-8.2 : 0.2 KELLERBERRIN Cent Wheatbelt WA
|
|
Sunniest &
dullest |
Windiest |
Highest gusts |
Todays highest rainfall totals for the 24 hours to 9am. It
includes the top 5 totals nationally followed by all reported falls of 50mm or more. |
Highest
and lowest recordings of hours of sunshine for the 24 hours to midnight. |
Highest wind
run totals in kilometres for the 24 hours to 9am (average speed in brackets).
All reported runs >
=25km/h are shown. |
Highest wind
gusts in km/h for the 24 hours to midnight followed by the hour in which it occurred.
All stations with gusts >
89km/h are shown. |
116.0 MOOMBA (TIRRAWARRA) NE Pastoral SA
43.0 POMONAL Wimmera S VIC
40.0 WADDIKEE W Agricultural SA
38.2 INNAMINCKA STATION NE Pastoral SA
38.0 KIMBA (CURTINYE) W Agricultural SA
SOUTH AUSTRALIA
NE Pastoral
116.0 MOOMBA (TIRRAWARRA)
38.2 INNAMINCKA STATION
W Agricultural
40.0 WADDIKEE
38.0 KIMBA (CURTINYE)
VICTORIA
Wimmera S
43.0 POMONAL
|
11.0 DARWIN AIRPORT N Rivers NT
10.7 WEIPA AERO N Peninsula QLD
10.2 RABBIT FLAT N Plateau NT
10.2 TOWNSVILLE AERO N Coast--Herbert QLD
10.1 WOOMERA AERODROME NW Pastoral SA
.....
2.2 MOUNT GAMBIER AERO Lower SE SA
0.9 BUNDOORA (LATROBE UNIVERSITY) E Central VIC
0.2 ALBANY AIRPORT Lower West WA
0.2 MELBOURNE AIRPORT E Central VIC
0.2 LAKE EILDON N Central VIC
|
1000 (41.7) WILLIS ISLAND Islands ISL
777 (32.4) NORTH ISLAND Central West WA
772 (32.2) LOW ISLES LIGHTHOUSE N Coast--Barron QLD
717 (29.9) CAPE FLATTERY N Coast--Barron QLD
681 (28.4) CAPE GRIM BAPS N Coast TAS
664 (27.7) HAMILTON ISLAND AIRPORT Central Coast E QLD
663 (27.6) HOPETOUN NORTH Lower West WA
624 (26.0) NEPTUNE ISLAND W Agricultural SA
618 (25.8) MCCLUER ISLAND N Rivers NT
617 (25.7) RUNDLE ISLAND Wide Bay/Burnett QLD
611 (25.5) CAPE WILLOUGHBY Yorke Pen/Kanga Is SA
601 (25.0) KILMORE GAP N Central VIC
|
74/07 BLACKALL AIRPORT Central West QLD
72/13 NEPTUNE ISLAND W Agricultural SA
71/17 BIRDSVILLE AIRPORT Channel Country QLD
63/02 CAPE WILLOUGHBY Yorke Pen/Kanga Is SA
63/10 DUNNS HILL E Central VIC
|
�