|
For notes on how to interpret
the data and quality control issues, see Daily Weather Summary Help.
**S** and **W** precede data flagged by the Bureau as suspicious or wrong
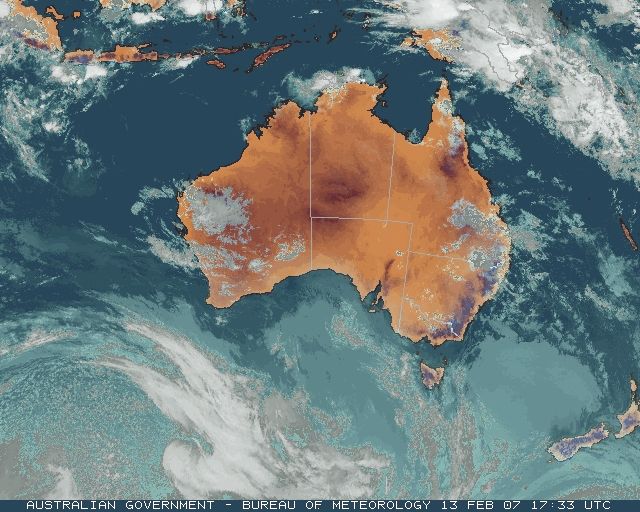
Data is as received at 00:06EST, 15/05/2012.
|
|
| |
Max
°
C |
+/- norm
°
C |
Min
°
C |
+/- norm
°
C |
Grass Min
°
C |
Rain to 9am mm |
Evaporation to 9am mm |
Sunshine hours |
Wind Run to 9am km (24-hour average km/h) |
Maximum Gust km/h / hour of occurrence |
| GERALDTON AIRPORT |
31.1 |
-1.4 |
19.4 |
+0.3 |
18.6 |
0.0 |
5.0 |
-- |
444 (18.5) |
52/17 |
| PERTH AIRPORT |
29.0 |
-2.8 |
11.3 |
-6.1 |
9.9 |
0.0 |
7.2 |
11.6 |
305 (12.7) |
37/16 |
| ALBANY AIRPORT |
28.1 |
+3.2 |
15.5 |
+1.1 |
12.8 |
0.0 |
7.0 |
12.0 |
385 (16.0) |
46/15 |
| BUNBURY |
24.5 |
-5.3 |
11.2 |
-4.4 |
-- |
0.0 |
-- |
-- |
275 (11.5) |
43/14 |
| MANDURAH |
24.2 |
-- |
16.8 |
-- |
-- |
0.0 |
-- |
-- |
267 (11.1) |
43/14 |
| DARWIN AIRPORT |
31.2 |
-0.2 |
24.0 |
-0.7 |
24.3 |
11.4 |
12.4 |
4.1 |
469 (19.5) |
50/08 |
| ALICE SPRINGS AIRPORT |
37.0 |
+1.9 |
18.1 |
-2.7 |
15.2 |
0.0 |
12.0 |
12.5 |
355 (14.8) |
55/12 |
| WHYALLA AERO |
27.6 |
-2.0 |
19.2 |
+1.5 |
-- |
0.0 |
-- |
-- |
489 (20.4) |
46/20 |
| ADELAIDE (KENT TOWN) |
34.4 |
+5.1 |
17.7 |
+0.6 |
14.1 |
0.0 |
8.0 |
12.7 |
201 ( 8.4) |
30/16 |
| MOUNT GAMBIER AERO |
26.1 |
+1.0 |
15.9 |
+4.3 |
14.0 |
0.0 |
5.2 |
10.1 |
455 (19.0) |
39/17 |
| MOUNT ISA AERO |
37.8 |
+2.5 |
19.7 |
-3.7 |
15.4 |
0.0 |
10.4 |
12.0 |
282 (11.8) |
37/16 |
| CAIRNS AERO |
30.7 |
-0.5 |
22.5 |
-1.2 |
22.3 |
64.4 |
-- |
3.9 |
203 ( 8.5) |
32/12 |
| TOWNSVILLE AERO |
31.5 |
+0.4 |
24.8 |
+0.7 |
22.4 |
3.0 |
8.8 |
11.8 |
427 (17.8) |
35/01 |
| MACKAY M.O |
29.5 |
-0.1 |
22.2 |
-1.2 |
-- |
0.4 |
-- |
9.4 |
235 ( 9.8) |
34/20 |
| ROCKHAMPTON AERO |
30.7 |
-0.6 |
21.4 |
-0.7 |
20.6 |
0.4 |
4.8 |
-- |
326 (13.6) |
35/14 |
| BUNDABERG AERO |
-- |
-- |
-- |
-- |
-- |
2.4 |
3.6 |
-- |
-- |
-- |
| NAMBOUR DPI |
27.8 |
-1.0 |
18.2 |
-1.5 |
-- |
37.0 |
1.0 |
-- |
83 ( 3.5) |
30/19 |
| COOLANGATTA |
28.2 |
0.0 |
18.5 |
-2.3 |
-- |
25.6 |
-- |
-- |
155 ( 6.5) |
39/12 |
| BRISBANE AERO |
27.9 |
-1.2 |
18.8 |
-2.3 |
17.6 |
9.0 |
0.0 |
8.7 |
243 (10.1) |
46/17 |
| TOOWOOMBA AIRPORT |
26.6 |
-0.8 |
16.8 |
-0.8 |
-- |
0.2 |
-- |
-- |
594 (24.8) |
58/15 |
| GUNNEDAH RESOURCE CENTRE |
31.5 |
+0.4 |
17.3 |
-1.3 |
13.6 |
0.0 |
6.4 |
-- |
305 (12.7) |
-- |
| COFFS HARBOUR MO |
26.3 |
-0.5 |
18.9 |
-0.6 |
18.2 |
41.0 |
1.2 |
9.5 |
-- |
32/09 |
| PORT MACQUARIE AIRPORT AWS |
26.8 |
-0.7 |
18.1 |
-0.2 |
-- |
2.0 |
-- |
-- |
-- |
-- |
| WILLIAMTOWN RAAF |
26.2 |
-1.3 |
15.1 |
-3.0 |
15.5 |
0.0 |
5.6 |
11.7 |
331 (13.8) |
34/14 |
| GOSFORD (NARARA RESEARCH STATION) AWS |
26.5 |
-0.6 |
13.9 |
-3.2 |
-- |
0.0 |
-- |
-- |
103 ( 4.3) |
22/10 |
| ORANGE AGRICULTURAL INSTITUTE |
26.0 |
+0.2 |
10.4 |
-2.7 |
6.6 |
0.0 |
5.4 |
11.5 |
-- |
-- |
| DUBBO AIRPORT AWS |
32.2 |
+0.2 |
17.4 |
-0.3 |
-- |
0.0 |
-- |
-- |
-- |
-- |
| SYDNEY AIRPORT AMO |
25.7 |
-0.6 |
18.1 |
-0.9 |
13.8 |
0.0 |
4.0 |
12.7 |
343 (14.3) |
32/14 |
| RICHMOND RAAF |
28.3 |
-0.7 |
16.7 |
-0.9 |
-- |
0.0 |
-- |
-- |
150 ( 6.3) |
52/14 |
| BELLAMBI AWS |
25.8 |
+1.0 |
16.3 |
-2.8 |
-- |
1.6 |
-- |
-- |
189 ( 7.9) |
24/10 |
| CANBERRA AIRPORT |
28.8 |
+1.7 |
11.7 |
-1.4 |
9.0 |
0.0 |
6.2 |
8.8 |
291 (12.1) |
48/16 |
| WAGGA WAGGA AMO |
32.9 |
+2.0 |
18.1 |
+1.8 |
17.0 |
0.0 |
11.6 |
9.4 |
347 (14.5) |
52/18 |
| ALBURY AIRPORT AWS |
33.8 |
+2.5 |
17.1 |
+1.0 |
-- |
0.0 |
-- |
-- |
196 ( 8.2) |
48/15 |
| MILDURA AIRPORT |
36.7 |
+5.1 |
20.9 |
+4.5 |
18.7 |
0.0 |
10.0 |
8.5 |
264 (11.0) |
43/15 |
| TATURA INST SUSTAINABLE AG |
34.3 |
+4.8 |
16.5 |
+2.2 |
-- |
0.0 |
8.0 |
-- |
237 ( 9.9) |
46/13 |
| BENDIGO AIRPORT |
34.7 |
+5.3 |
17.3 |
+3.2 |
-- |
0.0 |
-- |
-- |
265 (11.0) |
�
35/17 |
| MELBOURNE REGIONAL OFFICE |
27.5 |
+1.7 |
19.8 |
+5.2 |
16.0 |
0.2 |
4.2 |
-- |
122 ( 5.1) |
17/17 |
| GEELONG AIRPORT |
28.1 |
+3.1 |
16.5 |
+3.1 |
-- |
4.6 |
-- |
-- |
173 ( 7.2) |
37/16 |
| BALLARAT AERODROME |
32.4 |
+7.4 |
15.3 |
+3.9 |
-- |
0.0 |
-- |
-- |
352 (14.7) |
45/06 |
| LAUNCESTON (TI TREE BEND) |
28.9 |
+4.5 |
13.1 |
+1.1 |
-- |
0.0 |
-- |
-- |
-- |
41/15 |
| HOBART AIRPORT |
23.2 |
+0.9 |
15.6 |
+3.6 |
11.3 |
0.0 |
6.6 |
11.1 |
325 (13.5) |
41/18 |
| |
Max
°
C |
+/- norm
°
C |
Min
°
C |
+/- norm
°
C |
Grass Min
°
C |
Rain to 9am mm |
Evaporation to 9am mm |
Sunshine hours |
Wind Run to 9am km |
Maximum Gust km/h / hour of occurrence |
|
| Hottest |
| Highest maximum temperature> | Greatest variation above normal maximum |
Highest minimum temperature | Greatest variation above normal minimum |
47.0 GASCOYNE JUNCTION W Gascoyne WA
47.0 EMU CREEK STATION W Gascoyne WA
46.7 MARBLE BAR E Pilbara WA
46.2 PARABURDOO AERO E Gascoyne WA
45.8 TELFER AERO Interior WA
|
+11.2 : 38.6 JACUP Cent Wheatbelt WA
+10.6 : 38.1 ESPERANCE AERO Lower West WA
+10.6 : 39.0 RAVENSTHORPE Cent Wheatbelt WA
+10.3 : 39.9 SALMON GUMS RES.STN. Goldfields WA
+9.2 : 41.2 KALGOORLIE-BOULDER AIRPORT Goldfields WA
+9.2 : 35.7 MORWELL (LATROBE VALLEY AIRPORT) W Gippsland VIC
|
32.5 GASCOYNE JUNCTION W Gascoyne WA
32.4 EMU CREEK STATION W Gascoyne WA
31.4 MEEKATHARRA AIRPORT E Gascoyne WA
31.4 YEELIRRIE Goldfields WA
30.1 LEINSTER AERO Goldfields WA
|
+10.2 : 31.4 YEELIRRIE Goldfields WA
+8.0 : 30.1 LEINSTER AERO Goldfields WA
+8.0 : 32.5 GASCOYNE JUNCTION W Gascoyne WA
+7.7 : 31.4 MEEKATHARRA AIRPORT E Gascoyne WA
+7.4 : 32.4 EMU CREEK STATION W Gascoyne WA
|
| Coldest |
| Lowest maximum temperature | Greatest variation below normal maximum |
Lowest minimum temperature | Greatest variation below normal minimum |
16.8 MOUNT WELLINGTON Southeast TAS
16.9 THREDBO AWS Snowy Mtns NSW
17.8 MAATSUYKER ISLAND LIGHTHOUSE Southeast TAS
18.0 MOUNT GININI AWS Goulburn/Monaro NSW
18.2 PERISHER VALLEY SKI CENTRE Snowy Mtns NSW
|
-5.7 : 25.5 MEDINA RESEARCH CENTRE Lower West WA
-5.3 : 24.5 BUNBURY Lower West WA
-5.0 : 25.2 SWANBOURNE Lower West WA
-4.2 : 26.5 JURIEN BAY Lower West WA
-4.2 : 25.5 LANCELIN Lower West WA
|
0.0 PERISHER VALLEY SKI CENTRE Snowy Mtns NSW
6.0 MOUNT GININI AWS Goulburn/Monaro NSW
6.5 THREDBO VILLAGE Snowy Mtns NSW
6.8 LIAWENEE Central Plateau TAS
7.0 MOUNT WELLINGTON Southeast TAS
|
-8.2 : 11.0 CARNAMAH Central West WA
-6.6 : 17.0 RABBIT FLAT N Plateau NT
-6.4 : 10.2 GINGIN AERO Lower West WA
-6.3 : 10.5 JANDAKOT AERO Lower West WA
-6.1 : 11.3 PERTH AIRPORT Lower West WA
|
|
Sunniest &
dullest |
Windiest |
Highest gusts |
Todays highest rainfall totals for the 24 hours to 9am. It
includes the top 5 totals nationally followed by all reported falls of 50mm or more. |
Highest
and lowest recordings of hours of sunshine for the 24 hours to midnight. |
Highest wind
run totals in kilometres for the 24 hours to 9am (average speed in brackets).
All reported runs >
=25km/h are shown. |
Highest wind
gusts in km/h for the 24 hours to midnight followed by the hour in which it occurred.
All stations with gusts >
89km/h are shown. |
101.0 SANDY CAPE LIGHTHOUSE Wide Bay/Burnett QLD
88.4 GARRABARRA Maranoa QLD
71.0 LAKEFIELD NATIONAL PARK S Peninsula QLD
69.2 LAMB ISLAND PINE AVE Brisbane/SE Coast QLD
67.4 RUSSELL ISLAND Brisbane/SE Coast QLD
NORTHERN TERRITORY
N Rivers
52.2 GERIATRIC PARK
QUEENSLAND
S Peninsula
71.0 LAKEFIELD NATIONAL PARK
N Coast--Barron
64.4 CAIRNS AERO
59.0 KURANDA HILLTOP
52.0 TOPAZ
Central Highlands
57.0 ORION
51.0 WARRINILLA
Wide Bay/Burnett
101.0 SANDY CAPE LIGHTHOUSE
Brisbane/SE Coast
69.2 LAMB ISLAND PINE AVE
67.4 RUSSELL ISLAND
65.2 TEWANTIN RSL PARK
61.0 MAROOCHYDORE AERO
54.2 KARRAGARRA ISLAND
54.0 TEDDINGTON WEIR HW TM
Maranoa
88.4 GARRABARRA
NEW SOUTH WALES
North Coast
54.0 BENTLEY
53.0 TUNCESTER (LEYCESTER CREEK)
50.6 ROCK VALLEY (LEYCESTER CREEK)
MidNorth Coast N
57.5 WITTITRIN
57.4 CRESCENT HEAD
57.0 KEMPSEY AIRPORT AWS
54.0 EUROKA (ALDAVILLA)
MidNorth Coast S
52.0 KUNDABUNG (RAVENSWOOD RD)
|
12.8 COBAR MO Upper Darling NSW
12.7 ADELAIDE (KENT TOWN) Adelaide/Lofty SA
12.7 SYDNEY AIRPORT AMO Sydney--east NSW
12.6 ADELAIDE AIRPORT Adelaide/Lofty SA
12.6 NURIOOTPA VITICULTURAL Adelaide/Lofty SA
.....
4.1 DARWIN AIRPORT N Rivers NT
3.9 CAIRNS AERO N Coast--Barron QLD
3.7 MOREE AERO NW Plains E NSW
2.1 WALKAMIN DPI N Coast--Barron QLD
0.8 INVERELL RESEARCH CENTRE N Tablelands W NSW
|
1061 (44.2) CAPE GRIM BAPS N Coast TAS
743 (31.0) MOUNT READ W Coast TAS
720 (30.0) TASMAN ISLAND Southeast TAS
707 (29.5) SMITHTON AERODROME N Coast TAS
696 (29.0) RUNDLE ISLAND Wide Bay/Burnett QLD
682 (28.4) CARNARVON AIRPORT W Gascoyne WA
669 (27.9) LUNCHEON HILL (FORESTRY) N Coast TAS
660 (27.5) GREEN CAPE AWS South Coast NSW
643 (26.8) NEPTUNE ISLAND W Agricultural SA
642 (26.8) NORTH ISLAND Central West WA
637 (26.5) FLINDERS ISLAND AIRPORT Flinders Is/Bass St TAS
627 (26.1) LOW HEAD N Coast TAS
622 (25.9) LADY ELLIOT ISLAND Wide Bay/Burnett QLD
611 (25.5) MURRURUNDI GAP AWS Hunter Valley NSW
|
76/15 EILDON FIRE TOWER N Central VIC
74/19 THEVENARD ISLAND W Pilbara WA
74/ SWEERS ISLAND Gulf Country QLD
68/12 WULUNGURRU N Plateau NT
68/16 BLACKALL AIRPORT Central West QLD
|
�