|
For notes on how to interpret
the data and quality control issues, see Daily Weather Summary Help.
**S** and **W** precede data flagged by the Bureau as suspicious or wrong
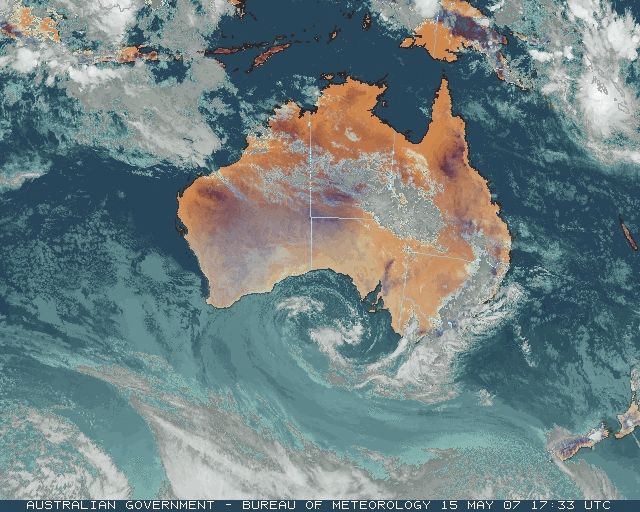
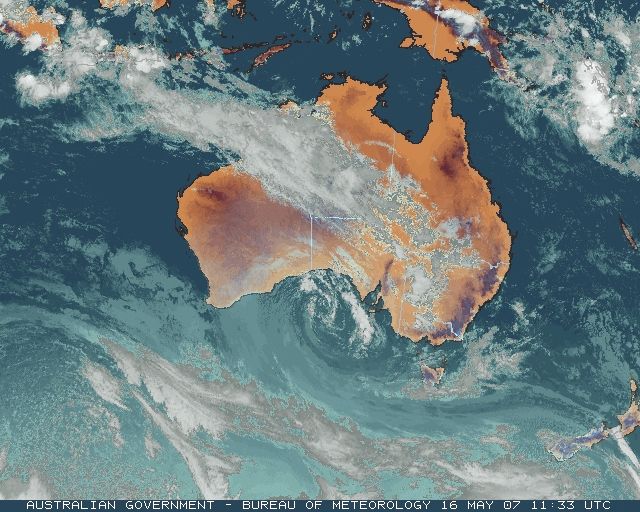
Data is as received at 00:35EST, 15/05/2012.
|
|
| |
Max
°
C |
+/- norm
°
C |
Min
°
C |
+/- norm
°
C |
Grass Min
°
C |
Rain to 9am mm |
Evaporation to 9am mm |
Sunshine hours |
Wind Run to 9am km (24-hour average km/h) |
Maximum Gust km/h / hour of occurrence |
| GERALDTON AIRPORT |
23.9 |
-0.1 |
6.6 |
-6.3 |
4.5 |
0.0 |
6.6 |
-- |
442 (18.4) |
39/09 |
| PERTH AIRPORT |
20.5 |
-1.2 |
5.0 |
-5.5 |
2.5 |
0.0 |
3.2 |
9.4 |
211 ( 8.8) |
41/10 |
| ALBANY AIRPORT |
14.8 |
-4.1 |
11.3 |
+1.5 |
8.2 |
0.2 |
1.4 |
0.3 |
247 (10.3) |
22/10 |
| BUNBURY |
19.1 |
-2.0 |
2.9 |
-6.6 |
-- |
0.0 |
-- |
-- |
173 ( 7.2) |
28/13 |
| MANDURAH |
19.3 |
-- |
10.4 |
-- |
-- |
0.0 |
-- |
-- |
260 (10.8) |
24/16 |
| DARWIN AIRPORT |
32.4 |
+0.4 |
24.7 |
+2.6 |
24.1 |
0.0 |
7.0 |
10.7 |
390 (16.3) |
35/12 |
| ALICE SPRINGS AIRPORT |
26.2 |
+3.2 |
14.3 |
+6.0 |
11.1 |
0.0 |
3.6 |
3.0 |
197 ( 8.2) |
30/12 |
| WHYALLA AERO |
22.6 |
+2.1 |
7.2 |
-1.5 |
-- |
0.0 |
7.8 |
-- |
316 (13.2) |
43/13 |
| ADELAIDE (KENT TOWN) |
21.3 |
+2.3 |
10.1 |
-0.1 |
-- |
0.0 |
2.0 |
9.7 |
204 ( 8.5) |
34/12 |
| MOUNT GAMBIER AERO |
18.3 |
+2.2 |
11.3 |
+4.0 |
9.3 |
11.6 |
1.4 |
5.6 |
325 (13.5) |
32/13 |
| MOUNT ISA AERO |
32.5 |
+4.6 |
21.0 |
+7.1 |
19.2 |
0.0 |
6.8 |
7.4 |
305 (12.7) |
32/09 |
| CAIRNS AERO |
28.6 |
+1.0 |
19.9 |
0.0 |
18.5 |
0.0 |
5.4 |
7.6 |
416 (17.3) |
39/12 |
| TOWNSVILLE AERO |
29.2 |
+1.6 |
18.3 |
+0.7 |
16.9 |
0.0 |
5.0 |
10.2 |
320 (13.3) |
35/12 |
| MACKAY M.O |
25.2 |
+1.0 |
18.4 |
+1.3 |
-- |
0.0 |
-- |
9.6 |
324 (13.5) |
32/12 |
| ROCKHAMPTON AERO |
28.8 |
+2.8 |
17.8 |
+3.6 |
15.9 |
0.2 |
3.4 |
-- |
201 ( 8.4) |
26/11 |
| BUNDABERG AERO |
27.3 |
+2.6 |
16.9 |
+2.7 |
-- |
2.0 |
3.8 |
-- |
301 (12.5) |
31/12 |
| NAMBOUR DPI |
25.9 |
+2.2 |
13.6 |
+1.6 |
-- |
0.0 |
1.0 |
-- |
38 ( 1.6) |
22/13 |
| COOLANGATTA |
25.1 |
+2.0 |
15.1 |
+0.8 |
-- |
0.2 |
-- |
-- |
185 ( 7.7) |
24/13 |
| BRISBANE AERO |
25.7 |
+2.1 |
15.5 |
+2.7 |
13.0 |
0.0 |
3.6 |
8.5 |
262 (10.9) |
22/13 |
| TOOWOOMBA AIRPORT |
22.7 |
+2.7 |
14.5 |
+4.5 |
-- |
0.0 |
-- |
-- |
492 (20.5) |
39/00 |
| GUNNEDAH RESOURCE CENTRE |
21.3 |
+1.0 |
14.2 |
+5.5 |
11.8 |
2.2 |
3.4 |
-- |
98 ( 4.1) |
-- |
| COFFS HARBOUR MO |
25.7 |
+4.3 |
15.0 |
+3.3 |
13.0 |
0.0 |
2.2 |
6.0 |
193 ( 8.0) |
28/11 |
| PORT MACQUARIE AIRPORT AWS |
23.7 |
+2.2 |
12.5 |
+2.0 |
-- |
0.0 |
-- |
-- |
-- |
-- |
| WILLIAMTOWN RAAF |
22.5 |
+2.3 |
11.8 |
+1.7 |
10.1 |
0.0 |
1.4 |
1.7 |
157 ( 6.5) |
26/12 |
| GOSFORD (NARARA RESEARCH STATION) AWS |
24.0 |
+3.6 |
12.2 |
+3.9 |
-- |
0.0 |
-- |
-- |
11 ( 0.5) |
11/11 |
| ORANGE AGRICULTURAL INSTITUTE |
18.9 |
+4.7 |
9.5 |
+4.8 |
6.9 |
0.4 |
1.4 |
6.5 |
-- |
-- |
| DUBBO AIRPORT AWS |
25.2 |
+5.2 |
14.9 |
+8.1 |
-- |
0.0 |
-- |
-- |
-- |
-- |
| SYDNEY AIRPORT AMO |
24.5 |
+4.5 |
15.5 |
+4.6 |
12.9 |
0.0 |
3.4 |
4.8 |
277 (11.5) |
26/15 |
| RICHMOND RAAF |
22.1 |
+1.5 |
11.2 |
+3.3 |
-- |
0.2 |
-- |
-- |
65 ( 2.7) |
15/10 |
| BELLAMBI AWS |
22.8 |
+3.1 |
16.8 |
+3.7 |
-- |
0.0 |
-- |
-- |
274 (11.4) |
37/11 |
| CANBERRA AIRPORT |
21.2 |
+5.6 |
8.3 |
+5.1 |
6.5 |
0.0 |
2.8 |
3.8 |
113 ( 4.7) |
13/14 |
| WAGGA WAGGA AMO |
22.6 |
+5.3 |
13.3 |
+7.4 |
12.6 |
0.0 |
2.4 |
6.1 |
217 ( 9.0) |
21/00 |
| ALBURY AIRPORT AWS |
22.2 |
+4.5 |
14.0 |
+8.4 |
-- |
0.4 |
-- |
-- |
45 ( 1.9) |
13/13 |
| MILDURA AIRPORT |
20.2 |
+1.2 |
13.6 |
+6.2 |
11.7 |
7.2 |
0.6 |
2.4 |
338 (14.1) |
35/23 |
| TATURA INST SUSTAINABLE AG |
22.4 |
+5.1 |
10.9 |
+5.1 |
-- |
3.7 |
0.1 |
-- |
135 ( 5.6) |
21/13 |
| BENDIGO AIRPORT |
18.3 |
+1.7 |
14.1 |
+8.9 |
-- |
9.4 |
-- |
-- |
230 ( 9.6) |
�
24/10 |
| MELBOURNE REGIONAL OFFICE |
23.1 |
+6.4 |
15.8 |
+7.2 |
14.0 |
5.8 |
1.6 |
-- |
99 ( 4.1) |
21/10 |
| GEELONG AIRPORT |
21.9 |
+4.8 |
12.4 |
+4.7 |
-- |
5.0 |
-- |
-- |
154 ( 6.4) |
24/10 |
| BALLARAT AERODROME |
18.0 |
+4.4 |
13.0 |
+7.3 |
-- |
3.0 |
-- |
-- |
562 (23.4) |
37/00 |
| LAUNCESTON (TI TREE BEND) |
15.0 |
-0.8 |
7.1 |
+2.0 |
-- |
1.0 |
-- |
-- |
62 ( 2.6) |
13/21 |
| HOBART AIRPORT |
16.5 |
+1.3 |
10.1 |
+3.5 |
6.9 |
0.0 |
1.0 |
0.0 |
191 ( 8.0) |
15/09 |
| |
Max
°
C |
+/- norm
°
C |
Min
°
C |
+/- norm
°
C |
Grass Min
°
C |
Rain to 9am mm |
Evaporation to 9am mm |
Sunshine hours |
Wind Run to 9am km |
Maximum Gust km/h / hour of occurrence |
|
| Hottest |
| Highest maximum temperature> | Greatest variation above normal maximum |
Highest minimum temperature | Greatest variation above normal minimum |
36.6 TIMBER CREEK N Rivers NT
36.2 KIDMAN SPRINGS N Rivers NT
35.9 CENTURY MINE Gulf Country QLD
35.5 DALY WATERS AWS N Rivers NT
35.5 VICTORIA RIVER DOWNS N Rivers NT
|
+7.4 : 26.0 PARKES (MACARTHUR STREET) CW Slopes S NSW
+6.7 : 29.8 MITCHELL POST OFFICE Maranoa QLD
+6.7 : 19.7 KATOOMBA (MURRI ST) C Tablelands S NSW
+6.7 : 22.0 NOOJEE (SLIVAR) W Gippsland VIC
+6.6 : 12.2 MOUNT WELLINGTON Southeast TAS
|
29.0 NORTHERN ENDEAVOUR Islands ISL
26.7 MCCLUER ISLAND N Rivers NT
26.2 BLACK POINT N Rivers NT
25.5 WARRUWI N Rivers NT
25.2 CENTRE ISLAND N Rivers NT
|
+10.2 : 21.5 WINDORAH POST OFFICE Channel Country QLD
+10.0 : 18.1 ROMA AIRPORT Maranoa QLD
+9.4 : 15.1 WEST WYALONG AIRPORT AWS CW Plains S NSW
+9.3 : 24.0 DOONGAN N Kimberley WA
+9.1 : 14.0 PARKES AIRPORT AWS CW Slopes S NSW
+9.1 : 20.8 BEDOURIE POLICE STATION Channel Country QLD
|
| Coldest |
| Lowest maximum temperature | Greatest variation below normal maximum |
Lowest minimum temperature | Greatest variation below normal minimum |
8.1 MT HOTHAM Upper NE VIC
8.9 THREDBO AWS Snowy Mtns NSW
9.4 MOUNT BULLER Upper NE VIC
9.8 MOUNT READ W Coast TAS
10.5 CHARLOTTE PASS (KOSCIUSKO CHALET) Snowy Mtns NSW
|
-6.7 : 26.5 WEST ROEBUCK W Kimberley WA
-6.4 : 26.1 BIDYADANGA W Kimberley WA
-5.3 : 17.0 LAVERTON AERO Goldfields WA
-5.1 : 15.2 ESPERANCE AERO Lower West WA
-5.0 : 15.5 ESPERANCE Lower West WA
-5.0 : 14.5 WAGIN Cent Wheatbelt WA
|
0.3 LAKE LEAKE (ELIZABETH RIVER) E Coast TAS
1.6 GINGIN AERO Lower West WA
1.9 COLLIE EAST Lower West WA
1.9 WANDERING Cent Wheatbelt WA
2.0 YEELIRRIE Goldfields WA
|
-8.2 : 2.7 PEARCE RAAF Lower West WA
-7.9 : 1.6 GINGIN AERO Lower West WA
-7.7 : 3.4 MURCHISON W Gascoyne WA
-6.9 : 5.0 JURIEN BAY Lower West WA
-6.7 : 5.2 MOUNT MAGNET AERO E Gascoyne WA
|
|
Sunniest &
dullest |
Windiest |
Highest gusts |
Todays highest rainfall totals for the 24 hours to 9am. It
includes the top 5 totals nationally followed by all reported falls of 50mm or more. |
Highest
and lowest recordings of hours of sunshine for the 24 hours to midnight. |
Highest wind
run totals in kilometres for the 24 hours to 9am (average speed in brackets).
All reported runs >
=25km/h are shown. |
Highest wind
gusts in km/h for the 24 hours to midnight followed by the hour in which it occurred.
All stations with gusts >
89km/h are shown. |
62.0 MAWBANNA (MAWBANNA ROAD) N Coast TAS
53.0 GRAMPIANS (MOUNT WILLIAM) Wimmera S VIC
44.2 NATIONAL PARK PARKS & WILDLIFE DEPOT Derwent Valley TAS
43.6 MAWBANNA (HARBY HILLS) N Coast TAS
37.2 MOYSTON (BARTON ESTATE) Wimmera S VIC
VICTORIA
Wimmera S
53.0 GRAMPIANS (MOUNT WILLIAM)
37.2 MOYSTON (BARTON ESTATE)
TASMANIA
N Coast
62.0 MAWBANNA (MAWBANNA ROAD)
43.6 MAWBANNA (HARBY HILLS)
Derwent Valley
44.2 NATIONAL PARK PARKS & WILDLIFE DEPOT
|
10.7 DARWIN AIRPORT N Rivers NT
10.3 GILES METEOROLOGICAL OFFICE Interior WA
10.3 WOOMERA AERODROME NW Pastoral SA
10.2 LOXTON RESEARCH CENTRE Murray Valley SA
10.2 TOWNSVILLE AERO N Coast--Herbert QLD
.....
0.2 GROVE (COMPARISON) Southeast TAS
0.0 BROOME AIRPORT W Kimberley WA
0.0 SCOTTSDALE (WEST MINSTONE ROAD) N Coast TAS
0.0 LAKE LEAKE (ELIZABETH RIVER) E Coast TAS
0.0 HOBART AIRPORT Southeast TAS
|
828 (34.5) NEPTUNE ISLAND W Agricultural SA
807 (33.6) MT HOTHAM Upper NE VIC
793 (33.0) WILLIS ISLAND Islands ISL
756 (31.5) CAPE FLATTERY N Coast--Barron QLD
734 (30.6) CAPE WILLOUGHBY Yorke Pen/Kanga Is SA
706 (29.4) LOW ISLES LIGHTHOUSE N Coast--Barron QLD
693 (28.9) MCCLUER ISLAND N Rivers NT
692 (28.8) NORTH ISLAND Central West WA
682 (28.4) MOUNT BULLER Upper NE VIC
673 (28.0) KILMORE GAP N Central VIC
600 (25.0) FORREST Eucla WA
|
72/16 WARRNAMBOOL AIRPORT NDB W Coast VIC
65/07 CAPE WILLOUGHBY Yorke Pen/Kanga Is SA
65/02 MOUNT BULLER Upper NE VIC
65/06 MT HOTHAM Upper NE VIC
63/07 WINTON AIRPORT Northwest QLD
|
�