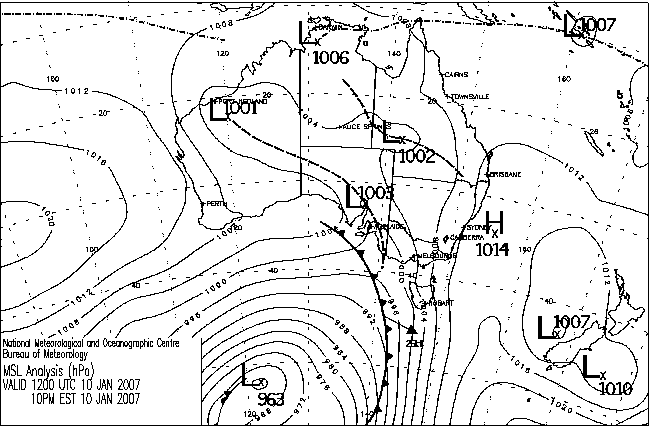
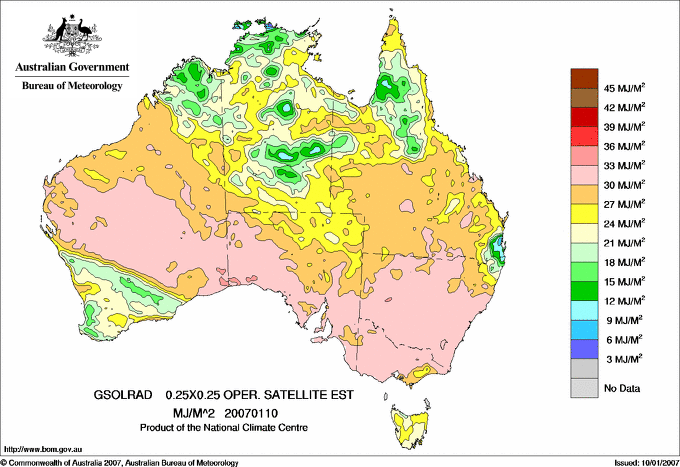
|
For notes on how to interpret
the data and quality control issues, see Daily Weather Summary Help.
**S** and **W** precede data flagged by the Bureau as suspicious or wrong
Data is as received at 23:55EST, 14/05/2012.
|
|
| |
Max
°
C |
+/- norm
°
C |
Min
°
C |
+/- norm
°
C |
Grass Min
°
C |
Rain to 9am mm |
Evaporation to 9am mm |
Sunshine hours |
Wind Run to 9am km (24-hour average km/h) |
Maximum Gust km/h / hour of occurrence |
| GERALDTON AIRPORT |
25.1 |
-6.5 |
19.3 |
+1.0 |
18.2 |
0.0 |
8.0 |
-- |
511 (21.3) |
43/18 |
| PERTH AIRPORT |
24.7 |
-6.9 |
17.1 |
+0.2 |
16.8 |
2.6 |
7.6 |
6.8 |
553 (23.0) |
50/10 |
| ALBANY AIRPORT |
19.3 |
-5.4 |
13.1 |
-0.6 |
11.9 |
3.4 |
6.2 |
7.6 |
568 (23.7) |
59/11 |
| BUNBURY |
23.1 |
-6.3 |
15.8 |
+0.7 |
-- |
1.8 |
-- |
-- |
583 (24.3) |
50/06 |
| MANDURAH |
22.7 |
-- |
17.2 |
-- |
-- |
1.6 |
-- |
-- |
644 (26.8) |
54/04 |
| DARWIN AIRPORT |
31.1 |
-0.7 |
25.0 |
+0.2 |
25.6 |
2.6 |
1.6 |
1.4 |
281 (11.7) |
48/14 |
| ALICE SPRINGS AIRPORT |
37.0 |
+0.6 |
27.3 |
+5.9 |
23.3 |
0.0 |
12.2 |
5.0 |
336 (14.0) |
44/14 |
| WHYALLA AERO |
44.0 |
+14.1 |
16.2 |
-1.2 |
-- |
0.0 |
12.0 |
-- |
214 ( 8.9) |
76/13 |
| ADELAIDE (KENT TOWN) |
40.2 |
+11.1 |
18.2 |
+1.2 |
11.2 |
0.0 |
7.0 |
11.0 |
205 ( 8.5) |
55/19 |
| MOUNT GAMBIER AERO |
38.6 |
+13.4 |
10.3 |
-0.8 |
5.5 |
0.0 |
6.8 |
12.5 |
304 (12.7) |
71/13 |
| MOUNT ISA AERO |
37.1 |
+0.8 |
26.7 |
+2.9 |
25.7 |
0.0 |
8.6 |
5.5 |
239 (10.0) |
48/15 |
| CAIRNS AERO |
32.8 |
+1.4 |
25.5 |
+1.8 |
23.8 |
0.0 |
7.4 |
9.0 |
269 (11.2) |
32/13 |
| TOWNSVILLE AERO |
33.8 |
+2.5 |
27.7 |
+3.5 |
27.0 |
0.0 |
7.6 |
8.4 |
380 (15.8) |
37/12 |
| MACKAY M.O |
33.9 |
+3.8 |
26.0 |
+2.5 |
-- |
0.0 |
-- |
6.5 |
415 (17.3) |
35/09 |
| ROCKHAMPTON AERO |
33.9 |
+2.0 |
22.7 |
+0.6 |
21.6 |
5.8 |
9.8 |
-- |
286 (11.9) |
30/17 |
| BUNDABERG AERO |
31.9 |
+1.8 |
21.6 |
+0.2 |
-- |
0.0 |
6.2 |
-- |
311 (13.0) |
34/15 |
| NAMBOUR DPI |
27.7 |
-1.6 |
21.3 |
+1.9 |
-- |
7.6 |
4.6 |
-- |
72 ( 3.0) |
17/15 |
| COOLANGATTA |
26.3 |
-1.8 |
20.1 |
-0.9 |
-- |
0.0 |
-- |
-- |
227 ( 9.5) |
21/09 |
| BRISBANE AERO |
26.3 |
-2.7 |
20.9 |
-0.2 |
20.5 |
0.0 |
3.2 |
0.4 |
349 (14.5) |
28/09 |
| TOOWOOMBA AIRPORT |
24.6 |
-3.5 |
16.9 |
-0.6 |
-- |
1.2 |
-- |
-- |
752 (31.3) |
45/15 |
| GUNNEDAH RESOURCE CENTRE |
35.3 |
+3.4 |
18.4 |
-0.4 |
14.5 |
0.0 |
9.6 |
-- |
251 (10.5) |
-- |
| COFFS HARBOUR MO |
25.6 |
-1.3 |
18.0 |
-1.4 |
16.9 |
0.0 |
2.8 |
8.8 |
195 ( 8.1) |
35/16 |
| PORT MACQUARIE AIRPORT AWS |
26.5 |
-0.9 |
15.8 |
-2.3 |
-- |
0.0 |
-- |
-- |
-- |
-- |
| WILLIAMTOWN RAAF |
26.0 |
-1.9 |
10.2 |
-7.8 |
8.9 |
0.0 |
6.2 |
11.5 |
259 (10.8) |
39/18 |
| GOSFORD (NARARA RESEARCH STATION) AWS |
25.9 |
-1.6 |
11.3 |
-5.4 |
-- |
0.0 |
-- |
-- |
110 ( 4.6) |
28/15 |
| ORANGE AGRICULTURAL INSTITUTE |
29.5 |
+3.0 |
11.8 |
-1.4 |
7.5 |
0.0 |
6.6 |
13.4 |
-- |
-- |
| DUBBO AIRPORT AWS |
35.8 |
+2.7 |
16.8 |
-1.3 |
-- |
0.0 |
-- |
-- |
-- |
-- |
| SYDNEY AIRPORT AMO |
26.5 |
+0.1 |
19.0 |
+0.3 |
15.0 |
0.0 |
6.8 |
12.8 |
355 (14.8) |
45/15 |
| RICHMOND RAAF |
32.6 |
+2.8 |
16.5 |
-0.9 |
-- |
0.0 |
-- |
-- |
180 ( 7.5) |
39/15 |
| BELLAMBI AWS |
24.1 |
-0.7 |
16.5 |
-2.4 |
-- |
0.0 |
-- |
-- |
162 ( 6.8) |
31/17 |
| CANBERRA AIRPORT |
33.3 |
+5.3 |
10.4 |
-2.8 |
7.5 |
0.0 |
7.2 |
13.5 |
293 (12.2) |
48/13 |
| WAGGA WAGGA AMO |
35.3 |
+3.7 |
16.2 |
0.0 |
11.8 |
0.0 |
10.0 |
13.6 |
255 (10.6) |
41/13 |
| ALBURY AIRPORT AWS |
35.6 |
+3.4 |
13.3 |
-3.3 |
-- |
0.0 |
-- |
-- |
109 ( 4.5) |
28/13 |
| MILDURA AIRPORT |
40.2 |
+8.0 |
17.8 |
+1.2 |
14.5 |
0.0 |
9.6 |
13.6 |
256 (10.7) |
45/12 |
| TATURA INST SUSTAINABLE AG |
34.6 |
+5.1 |
8.2 |
-5.9 |
-- |
0.0 |
5.6 |
-- |
178 ( 7.4) |
46/12 |
| BENDIGO AIRPORT |
35.8 |
+6.3 |
9.8 |
-4.1 |
-- |
0.0 |
-- |
-- |
202 ( 8.4) |
�
48/14 |
| MELBOURNE REGIONAL OFFICE |
37.6 |
+11.7 |
14.3 |
0.0 |
11.5 |
0.0 |
4.6 |
-- |
121 ( 5.0) |
32/12 |
| GEELONG AIRPORT |
38.3 |
+13.7 |
9.0 |
-4.1 |
-- |
0.0 |
-- |
-- |
243 (10.1) |
54/13 |
| BALLARAT AERODROME |
34.3 |
+9.3 |
10.2 |
-0.6 |
-- |
0.0 |
-- |
-- |
298 (12.4) |
55/11 |
| LAUNCESTON (TI TREE BEND) |
22.9 |
-1.3 |
10.9 |
-1.2 |
-- |
0.0 |
-- |
-- |
199 ( 8.3) |
34/14 |
| HOBART AIRPORT |
24.1 |
+1.6 |
10.3 |
-1.7 |
6.6 |
0.0 |
5.6 |
13.5 |
386 (16.1) |
35/15 |
| |
Max
°
C |
+/- norm
°
C |
Min
°
C |
+/- norm
°
C |
Grass Min
°
C |
Rain to 9am mm |
Evaporation to 9am mm |
Sunshine hours |
Wind Run to 9am km |
Maximum Gust km/h / hour of occurrence |
|
| Hottest |
| Highest maximum temperature> | Greatest variation above normal maximum |
Highest minimum temperature | Greatest variation above normal minimum |
44.5 PORT HEDLAND AIRPORT E Pilbara WA
44.5 MARBLE BAR E Pilbara WA
44.0 COOBER PEDY AIRPORT NW Pastoral SA
44.0 ROXBY DOWNS (OLYMPIC DAM AERODROME) NW Pastoral SA
44.0 TARCOOLA AERO NW Pastoral SA
44.0 WHYALLA AERO W Agricultural SA
|
+17.8 : 43.5 NORTH SHIELDS (PORT LINCOLN AWS) W Agricultural SA
+17.3 : 42.3 EDITHBURGH Yorke Pen/Kanga Is SA
+17.2 : 39.8 PORT FAIRY AWS W Coast VIC
+16.5 : 37.5 CAPE NELSON LIGHTHOUSE W Coast VIC
+16.0 : 38.6 AIREYS INLET W Coast VIC
|
30.0 ROEBOURNE AERO E Pilbara WA
29.8 TELFER AERO Interior WA
29.4 WITTENOOM W Pilbara WA
29.3 ROEBOURNE E Pilbara WA
29.1 OODNADATTA AIRPORT NE Pastoral SA
|
+6.7 : 28.5 MARLA POLICE STATION NW Pastoral SA
+6.2 : 29.1 OODNADATTA AIRPORT NE Pastoral SA
+5.9 : 27.3 ALICE SPRINGS AIRPORT N Plateau NT
+4.6 : 26.6 COOBER PEDY AIRPORT NW Pastoral SA
+4.5 : 20.5 FORREST Eucla WA
|
| Coldest |
| Lowest maximum temperature | Greatest variation below normal maximum |
Lowest minimum temperature | Greatest variation below normal minimum |
16.0 TASMAN ISLAND Southeast TAS
16.9 MOUNT READ W Coast TAS
17.3 MOUNT WELLINGTON Southeast TAS
18.5 PEMBERTON Lower West WA
18.6 ALBANY Lower West WA
|
-9.7 : 27.2 MORAWA AIRPORT Central West WA
-9.6 : 21.0 KARNET Lower West WA
-9.5 : 27.3 MULLEWA Central West WA
-9.4 : 21.0 BICKLEY Lower West WA
-9.0 : 27.0 CARNAMAH Central West WA
|
1.1 CHARLOTTE PASS (KOSCIUSKO CHALET) Snowy Mtns NSW
1.8 LAKE LEAKE (ELIZABETH RIVER) E Coast TAS
2.0 PERISHER VALLEY SKI CENTRE Snowy Mtns NSW
3.4 TARRALEAH VILLAGE Derwent Valley TAS
3.7 THREDBO VILLAGE Snowy Mtns NSW
|
-7.8 : 10.2 WILLIAMTOWN RAAF Hunter Valley NSW
-7.0 : 4.5 STRATHBOGIE Lower NE VIC
-6.6 : 15.5 MURCHISON W Gascoyne WA
-6.5 : 11.3 MAITLAND VISITORS CENTRE Hunter Valley NSW
-6.4 : 1.8 LAKE LEAKE (ELIZABETH RIVER) E Coast TAS
|
|
Sunniest &
dullest |
Windiest |
Highest gusts |
Todays highest rainfall totals for the 24 hours to 9am. It
includes the top 5 totals nationally followed by all reported falls of 50mm or more. |
Highest
and lowest recordings of hours of sunshine for the 24 hours to midnight. |
Highest wind
run totals in kilometres for the 24 hours to 9am (average speed in brackets).
All reported runs >
=25km/h are shown. |
Highest wind
gusts in km/h for the 24 hours to midnight followed by the hour in which it occurred.
All stations with gusts >
89km/h are shown. |
108.0 DRYSDALE RIVER STATION N Kimberley WA
77.4 PALMERVILLE S Peninsula QLD
76.8 BULMAN AWS N Rivers NT
71.0 BLINA W Kimberley WA
70.4 TANDANGLE HILL N Rivers NT
WESTERN AUSTRALIA
N Kimberley
108.0 DRYSDALE RIVER STATION
W Kimberley
71.0 BLINA
56.8 MOUNT BARNETT
NORTHERN TERRITORY
N Rivers
76.8 BULMAN AWS
70.4 TANDANGLE HILL
57.2 WARRUWI
56.0 SHOEING TOOL BORE
QUEENSLAND
S Peninsula
77.4 PALMERVILLE
Gulf Country
51.0 DALGONALLY STATION
Upper Carpentaria
69.8 ABINGDON DOWNS STATION
Brisbane/SE Coast
53.2 DUNOLLIE
|
13.6 WAGGA WAGGA AMO SW Slopes S NSW
13.6 MILDURA AIRPORT Mallee N VIC
13.5 CEDUNA AMO W Agricultural SA
13.5 CANBERRA AIRPORT Goulburn/Monaro NSW
13.5 HOBART AIRPORT Southeast TAS
.....
5.2 WALKAMIN DPI N Coast--Barron QLD
5.0 ALICE SPRINGS AIRPORT N Plateau NT
1.4 DARWIN AIRPORT N Rivers NT
1.4 LARRIMAH N Rivers NT
0.4 BRISBANE AERO Brisbane/SE Coast QLD
|
1155 (48.1) CAPE LEEUWIN Lower West WA
1113 (46.4) WILSONS PROMONTORY LIGHTHOUSE W Gippsland VIC
942 (39.3) HOGAN ISLAND Islands ISL
925 (38.5) CAPE NATURALISTE Lower West WA
913 (38.0) CAPE GRIM BAPS N Coast TAS
832 (34.7) VARANUS ISLAND Islands ISL
813 (33.9) CARNARVON AIRPORT W Gascoyne WA
783 (32.6) BARROW ISLAND AIRPORT W Pilbara WA
770 (32.1) THEVENARD ISLAND W Pilbara WA
752 (31.3) TOOWOOMBA AIRPORT Darling Downs E QLD
730 (30.4) ROTTNEST ISLAND Lower West WA
696 (29.0) SMITHTON AERODROME N Coast TAS
693 (28.9) CAPE MORETON LIGHTHOUSE Brisbane/SE Coast QLD
681 (28.4) KING ISLAND AIRPORT King Island TAS
676 (28.2) ONSLOW AIRPORT W Pilbara WA
675 (28.1) GARDEN ISLAND HSF Lower West WA
662 (27.6) LEARMONTH AIRPORT W Pilbara WA
648 (27.0) JACUP Cent Wheatbelt WA
644 (26.8) MANDURAH Lower West WA
634 (26.4) CUNDERDIN AIRFIELD Cent Wheatbelt WA
629 (26.2) KARRATHA AERO E Pilbara WA
627 (26.1) OAKEY AERO Darling Downs E QLD
625 (26.0) SWANBOURNE Lower West WA
614 (25.6) TASMAN ISLAND Southeast TAS
610 (25.4) LUCINDA POINT N Coast--Herbert QLD
607 (25.3) LOW HEAD N Coast TAS
|
106/22 MOUNT READ W Coast TAS
91/22 CAPE GRIM BAPS N Coast TAS
81/14 NORTH SHIELDS (PORT LINCOLN AWS) W Agricultural SA
80/14 SNOWTOWN (RAYVILLE PARK) Lower North SA
80/13 COLAC (MT GELLIBRAND) W Coast VIC
80/18 TASMAN ISLAND Southeast TAS
|
�