|
For notes on how to interpret
the data and quality control issues, see Daily Weather Summary Help.
**S** and **W** precede data flagged by the Bureau as suspicious or wrong
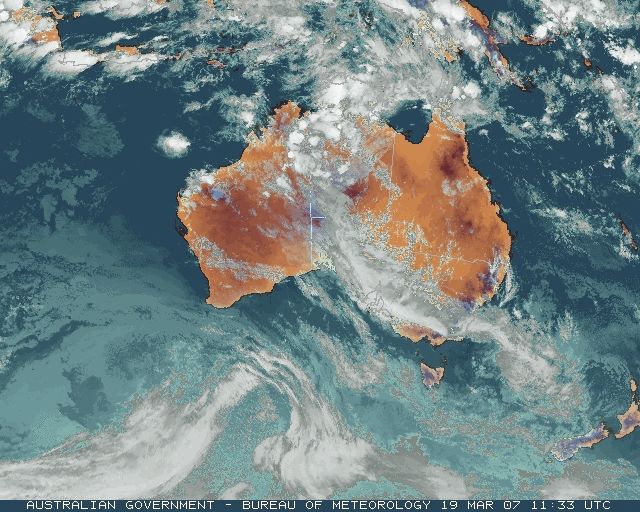
Data is as received at 00:15EST, 15/05/2012.
|
|
| |
Max
°
C |
+/- norm
°
C |
Min
°
C |
+/- norm
°
C |
Grass Min
°
C |
Rain to 9am mm |
Evaporation to 9am mm |
Sunshine hours |
Wind Run to 9am km (24-hour average km/h) |
Maximum Gust km/h / hour of occurrence |
| GERALDTON AIRPORT |
38.7 |
+7.8 |
21.7 |
+3.8 |
19.4 |
0.0 |
12.0 |
-- |
407 (17.0) |
41/15 |
| PERTH AIRPORT |
35.3 |
+5.7 |
22.2 |
+6.4 |
20.7 |
0.0 |
10.0 |
9.1 |
440 (18.3) |
48/03 |
| ALBANY AIRPORT |
24.5 |
+0.4 |
17.5 |
+4.1 |
16.9 |
8.8 |
7.8 |
6.8 |
307 (12.8) |
39/13 |
| BUNBURY |
31.6 |
+4.1 |
19.7 |
+5.7 |
-- |
0.2 |
-- |
-- |
287 (12.0) |
39/18 |
| MANDURAH |
30.7 |
-- |
23.2 |
-- |
-- |
0.0 |
-- |
-- |
333 (13.9) |
52/04 |
| DARWIN AIRPORT |
30.3 |
-1.6 |
24.7 |
+0.2 |
24.3 |
9.0 |
2.6 |
2.8 |
182 ( 7.6) |
30/17 |
| ALICE SPRINGS AIRPORT |
33.8 |
+1.1 |
21.0 |
+3.5 |
18.7 |
0.0 |
8.6 |
10.7 |
335 (14.0) |
43/11 |
| WHYALLA AERO |
20.8 |
-6.5 |
18.7 |
+3.4 |
-- |
3.4 |
10.2 |
-- |
241 (10.0) |
28/22 |
| ADELAIDE (KENT TOWN) |
26.1 |
-0.2 |
19.1 |
+3.9 |
-- |
0.0 |
15.4 |
3.4 |
240 (10.0) |
-- |
| MOUNT GAMBIER AERO |
25.7 |
+2.6 |
8.6 |
-1.9 |
3.8 |
0.0 |
3.6 |
9.9 |
328 (13.7) |
34/16 |
| MOUNT ISA AERO |
34.3 |
0.0 |
20.9 |
-0.9 |
19.0 |
0.0 |
9.6 |
11.0 |
292 (12.2) |
39/09 |
| CAIRNS AERO |
31.0 |
+0.5 |
23.5 |
+0.5 |
21.4 |
2.2 |
4.6 |
7.7 |
452 (18.8) |
39/11 |
| TOWNSVILLE AERO |
30.9 |
+0.2 |
21.1 |
-1.8 |
19.1 |
0.0 |
8.6 |
11.0 |
417 (17.4) |
41/13 |
| MACKAY M.O |
28.6 |
0.0 |
22.9 |
+0.7 |
-- |
4.8 |
-- |
7.3 |
552 (23.0) |
58/09 |
| ROCKHAMPTON AERO |
30.0 |
-0.5 |
21.9 |
+1.1 |
20.8 |
0.0 |
6.2 |
-- |
409 (17.0) |
45/09 |
| BUNDABERG AERO |
30.0 |
+0.9 |
19.5 |
-0.4 |
-- |
0.4 |
6.6 |
-- |
453 (18.9) |
44/12 |
| NAMBOUR DPI |
28.4 |
+0.5 |
18.6 |
+0.4 |
-- |
0.0 |
8.2 |
-- |
90 ( 3.8) |
28/15 |
| COOLANGATTA |
28.8 |
+1.6 |
21.5 |
+1.9 |
-- |
0.8 |
-- |
-- |
227 ( 9.5) |
30/14 |
| BRISBANE AERO |
28.6 |
+0.6 |
18.1 |
-1.2 |
14.5 |
0.0 |
7.2 |
10.6 |
284 (11.8) |
34/12 |
| TOOWOOMBA AIRPORT |
27.9 |
+1.5 |
16.6 |
+0.5 |
-- |
0.0 |
-- |
-- |
667 (27.8) |
48/09 |
| GUNNEDAH RESOURCE CENTRE |
30.1 |
+1.0 |
20.1 |
+3.5 |
16.0 |
0.2 |
4.6 |
-- |
532 (22.2) |
-- |
| COFFS HARBOUR MO |
26.4 |
+0.5 |
19.6 |
+1.5 |
19.0 |
6.0 |
1.6 |
4.9 |
383 (16.0) |
26/17 |
| PORT MACQUARIE AIRPORT AWS |
27.3 |
+1.0 |
17.3 |
+0.6 |
-- |
0.6 |
-- |
-- |
-- |
-- |
| WILLIAMTOWN RAAF |
30.0 |
+3.8 |
16.9 |
+0.6 |
15.1 |
0.2 |
1.8 |
8.2 |
235 ( 9.8) |
24/11 |
| GOSFORD (NARARA RESEARCH STATION) AWS |
27.8 |
+1.8 |
15.7 |
+0.4 |
-- |
1.0 |
-- |
-- |
20 ( 0.8) |
18/13 |
| ORANGE AGRICULTURAL INSTITUTE |
27.0 |
+4.2 |
14.8 |
+4.2 |
11.8 |
0.0 |
4.8 |
3.5 |
-- |
-- |
| DUBBO AIRPORT AWS |
33.1 |
+4.0 |
19.2 |
+4.7 |
-- |
0.0 |
-- |
-- |
-- |
-- |
| SYDNEY AIRPORT AMO |
25.9 |
+0.7 |
19.0 |
+1.6 |
16.4 |
0.2 |
1.6 |
3.3 |
298 (12.4) |
34/10 |
| RICHMOND RAAF |
24.2 |
-2.7 |
17.4 |
+1.9 |
-- |
0.6 |
-- |
-- |
55 ( 2.3) |
22/16 |
| BELLAMBI AWS |
25.4 |
+1.5 |
19.1 |
+1.1 |
-- |
0.0 |
-- |
-- |
329 (13.7) |
35/07 |
| CANBERRA AIRPORT |
19.7 |
-4.8 |
15.5 |
+4.8 |
14.3 |
1.4 |
3.4 |
0.0 |
201 ( 8.4) |
30/16 |
| WAGGA WAGGA AMO |
22.3 |
-5.4 |
18.5 |
+5.1 |
18.5 |
5.8 |
7.2 |
0.0 |
318 (13.3) |
32/01 |
| ALBURY AIRPORT AWS |
25.3 |
-2.6 |
16.3 |
+3.7 |
-- |
0.0 |
-- |
-- |
109 ( 4.5) |
31/12 |
| MILDURA AIRPORT |
18.9 |
-9.4 |
13.5 |
-0.3 |
13.1 |
2.6 |
6.2 |
0.0 |
213 ( 8.9) |
28/15 |
| TATURA INST SUSTAINABLE AG |
19.7 |
-6.6 |
14.3 |
+2.6 |
-- |
0.0 |
18.0 |
-- |
203 ( 8.5) |
28/10 |
| BENDIGO AIRPORT |
23.3 |
-2.7 |
13.1 |
+1.8 |
-- |
0.0 |
-- |
-- |
307 (12.8) |
�
30/13 |
| MELBOURNE REGIONAL OFFICE |
24.7 |
+0.8 |
13.4 |
+0.2 |
12.6 |
0.0 |
4.2 |
-- |
121 ( 5.0) |
18/12 |
| GEELONG AIRPORT |
21.8 |
-1.4 |
11.8 |
0.0 |
-- |
0.0 |
-- |
-- |
265 (11.0) |
35/14 |
| BALLARAT AERODROME |
27.3 |
+5.1 |
11.0 |
+1.1 |
-- |
0.0 |
-- |
-- |
554 (23.1) |
37/21 |
| LAUNCESTON (TI TREE BEND) |
23.1 |
+0.6 |
8.1 |
-1.9 |
-- |
0.0 |
-- |
-- |
137 ( 5.7) |
34/16 |
| HOBART AIRPORT |
19.7 |
-1.0 |
8.1 |
-2.6 |
4.6 |
0.0 |
5.2 |
9.6 |
291 (12.1) |
32/16 |
| |
Max
°
C |
+/- norm
°
C |
Min
°
C |
+/- norm
°
C |
Grass Min
°
C |
Rain to 9am mm |
Evaporation to 9am mm |
Sunshine hours |
Wind Run to 9am km |
Maximum Gust km/h / hour of occurrence |
|
| Hottest |
| Highest maximum temperature> | Greatest variation above normal maximum |
Highest minimum temperature | Greatest variation above normal minimum |
41.0 SHARK BAY AIRPORT W Gascoyne WA
39.7 EMU CREEK STATION W Gascoyne WA
39.3 ENEABBA Central West WA
39.2 WHITE CLIFFS POST OFFICE Far Northwest NSW
39.0 CARNARVON AIRPORT W Gascoyne WA
39.0 WHITE CLIFFS AWS Far Northwest NSW
|
+7.8 : 38.7 GERALDTON AIRPORT Central West WA
+7.5 : 39.0 CARNARVON AIRPORT W Gascoyne WA
+7.5 : 39.2 WHITE CLIFFS POST OFFICE Far Northwest NSW
+6.9 : 37.0 COBAR MO Upper Darling NSW
|
28.0 NORTHERN ENDEAVOUR Islands ISL
27.8 MARDIE W Pilbara WA
27.4 ROEBOURNE E Pilbara WA
27.3 KARRATHA AERO E Pilbara WA
27.1 THEVENARD ISLAND W Pilbara WA
|
+7.7 : 18.4 YOUNG AIRPORT SW Slopes N NSW
+7.6 : 24.0 COONAMBLE COMPARISON CW Plains N NSW
+7.5 : 19.9 COWRA AIRPORT COMPARISON CW Slopes S NSW
+7.4 : 23.9 COONAMBLE AIRPORT AWS CW Plains N NSW
+7.3 : 21.0 PARKES AIRPORT AWS CW Slopes S NSW
|
| Coldest |
| Lowest maximum temperature | Greatest variation below normal maximum |
Lowest minimum temperature | Greatest variation below normal minimum |
11.4 THREDBO AWS Snowy Mtns NSW
12.2 MT HOTHAM Upper NE VIC
12.3 CHARLOTTE PASS (KOSCIUSKO CHALET) Snowy Mtns NSW
12.6 MOUNT WELLINGTON Southeast TAS
13.0 MOUNT GININI AWS Goulburn/Monaro NSW
|
-10.2 : 19.0 BALRANALD (RSL) Southwest Plains NSW
-10.1 : 18.4 OUYEN (POST OFFICE) Mallee N VIC
-9.9 : 19.5 GLUEPOT RESERVE (GLUEPOT) Northeast SA
-9.4 : 18.9 MILDURA AIRPORT Mallee N VIC
-9.3 : 18.6 WALPEUP RESEARCH Mallee N VIC
|
-1.7 LIAWENEE Central Plateau TAS
1.3 OUSE FIRE STATION Derwent Valley TAS
1.6 TARRALEAH VILLAGE Derwent Valley TAS
|
-6.4 : 1.3 OUSE FIRE STATION Derwent Valley TAS
-6.0 : 5.9 KING ISLAND AIRPORT King Island TAS
-5.9 : 2.5 BUSHY PARK (BUSHY PARK ESTATES) Derwent Valley TAS
-5.3 : 2.7 GROVE (COMPARISON) Southeast TAS
-5.0 : 2.3 TUNNACK FIRE STATION Southeast TAS
|
|
Sunniest &
dullest |
Windiest |
Highest gusts |
Todays highest rainfall totals for the 24 hours to 9am. It
includes the top 5 totals nationally followed by all reported falls of 50mm or more. |
Highest
and lowest recordings of hours of sunshine for the 24 hours to midnight. |
Highest wind
run totals in kilometres for the 24 hours to 9am (average speed in brackets).
All reported runs >
=25km/h are shown. |
Highest wind
gusts in km/h for the 24 hours to midnight followed by the hour in which it occurred.
All stations with gusts >
89km/h are shown. |
102.0 PROMISED LAND (BELLINGEN (CRYSTAL CREEKS MidNorth Coast N NSW
91.4 ALYANGULA POLICE N Rivers NT
90.8 WULUNGURRU N Plateau NT
81.6 LAWRENCE POST OFFICE North Coast NSW
81.0 BAMAGA N Peninsula QLD
NORTHERN TERRITORY
N Rivers
91.4 ALYANGULA POLICE
80.0 BING BONG PORT
73.4 GILNOCKIE
66.8 LARRIMAH
65.0 RIVEREN
59.0 NHULUNBUY DTW
56.6 MONTEJINNI
55.4 UPPER VICTORIA RIVER
54.2 TANUMBIRINI
54.0 ALCAN REFINERY
52.0 MARYFIELD
51.4 SNOWDROP CREEK
N Plateau
90.8 WULUNGURRU
SOUTH AUSTRALIA
W Agricultural
64.0 IRON KNOB (GILLES DOWNS)
QUEENSLAND
N Peninsula
81.0 BAMAGA
56.0 BATAVIA DOWNS STATION
50.2 THURSDAY ISLAND TOWNSHIP
Gulf Country
59.8 PORMPURAAW TOWNSHIP
59.0 SWEERS ISLAND
NEW SOUTH WALES
North Coast
81.6 LAWRENCE POST OFFICE
MidNorth Coast N
102.0 PROMISED LAND (BELLINGEN (CRYSTAL CREEKS
68.0 BOWRA SUGARLOAF
59.1 DORRIGO (OLD CORAMBA RD)
|
11.0 MOUNT ISA AERO Gulf Country QLD
11.0 TOWNSVILLE AERO N Coast--Herbert QLD
11.0 BRIAN PASTURES Brisbane/SE Coast QLD
10.9 BICHENO (COUNCIL DEPOT) E Coast TAS
10.8 COBAR MO Upper Darling NSW
.....
0.0 WOOMERA AERODROME NW Pastoral SA
0.0 NURIOOTPA VITICULTURAL Adelaide/Lofty SA
0.0 LOXTON RESEARCH CENTRE Murray Valley SA
0.0 CANBERRA AIRPORT Goulburn/Monaro NSW
0.0 WAGGA WAGGA AMO SW Slopes S NSW
0.0 MILDURA AIRPORT Mallee N VIC
|
945 (39.4) RUNDLE ISLAND Wide Bay/Burnett QLD
923 (38.5) HAMILTON ISLAND AIRPORT Central Coast E QLD
901 (37.5) MAATSUYKER ISLAND LIGHTHOUSE Southeast TAS
865 (36.0) WILLIS ISLAND Islands ISL
857 (35.7) DOUBLE ISLAND POINT LIGHTHOUSE Brisbane/SE Coast QLD
817 (34.0) LOW ISLES LIGHTHOUSE N Coast--Barron QLD
804 (33.5) LADY ELLIOT ISLAND Wide Bay/Burnett QLD
685 (28.5) MT HOTHAM Upper NE VIC
675 (28.1) HERON ISLAND RES STN Wide Bay/Burnett QLD
667 (27.8) TOOWOOMBA AIRPORT Darling Downs E QLD
645 (26.9) CAPE MORETON LIGHTHOUSE Brisbane/SE Coast QLD
642 (26.8) LORD HOWE ISLAND AERO Islands ISL
638 (26.6) STENHOUSE BAY Yorke Pen/Kanga Is SA
629 (26.2) MINLATON AERO Yorke Pen/Kanga Is SA
612 (25.5) ROSEWORTHY AWS Adelaide/Lofty SA
607 (25.3) CAPE WILLOUGHBY Yorke Pen/Kanga Is SA
|
76/22 THREDBO AWS Snowy Mtns NSW
70/13 MT HOTHAM Upper NE VIC
63/13 FALLS CREEK Upper NE VIC
61/12 WILLIS ISLAND Islands ISL
59/01 LOW ISLES LIGHTHOUSE N Coast--Barron QLD
|
�