|
For notes on how to interpret
the data and quality control issues, see Daily Weather Summary Help.
**S** and **W** precede data flagged by the Bureau as suspicious or wrong
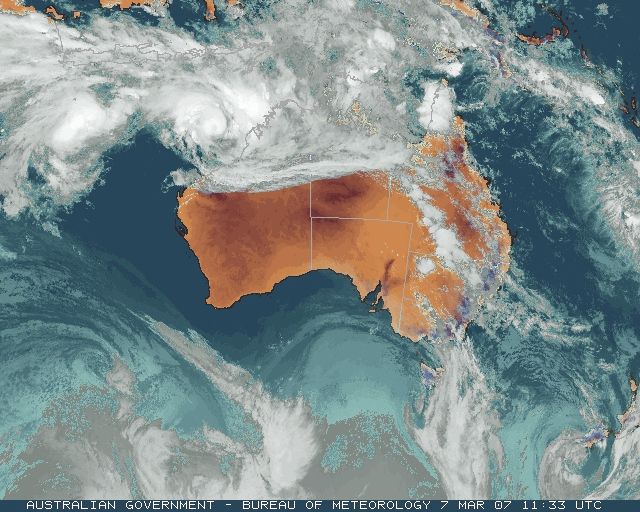
Data is as received at 00:12EST, 15/05/2012.
|
|
| |
Max
°
C |
+/- norm
°
C |
Min
°
C |
+/- norm
°
C |
Grass Min
°
C |
Rain to 9am mm |
Evaporation to 9am mm |
Sunshine hours |
Wind Run to 9am km (24-hour average km/h) |
Maximum Gust km/h / hour of occurrence |
| GERALDTON AIRPORT |
43.6 |
+12.7 |
25.8 |
+7.9 |
21.2 |
0.0 |
18.8 |
-- |
501 (20.9) |
54/10 |
| PERTH AIRPORT |
42.7 |
+13.1 |
20.5 |
+4.7 |
15.8 |
0.0 |
11.8 |
11.7 |
400 (16.7) |
41/09 |
| ALBANY AIRPORT |
40.7 |
+16.6 |
14.6 |
+1.2 |
11.0 |
0.0 |
9.8 |
12.0 |
363 (15.1) |
41/14 |
| BUNBURY |
37.8 |
+10.3 |
16.8 |
+2.8 |
-- |
0.0 |
-- |
-- |
201 ( 8.4) |
24/08 |
| MANDURAH |
36.4 |
-- |
25.1 |
-- |
-- |
0.0 |
-- |
-- |
315 (13.1) |
37/08 |
| DARWIN AIRPORT |
31.5 |
-0.4 |
24.3 |
-0.2 |
24.8 |
1.0 |
3.6 |
1.1 |
302 (12.6) |
45/15 |
| ALICE SPRINGS AIRPORT |
31.9 |
-0.8 |
14.6 |
-2.9 |
11.2 |
0.0 |
13.4 |
11.8 |
362 (15.1) |
41/11 |
| WHYALLA AERO |
26.8 |
-0.5 |
13.4 |
-1.9 |
-- |
0.0 |
5.8 |
-- |
442 (18.4) |
54/15 |
| ADELAIDE (KENT TOWN) |
27.5 |
+1.2 |
11.7 |
-3.5 |
6.8 |
0.0 |
4.2 |
10.2 |
-- |
39/16 |
| MOUNT GAMBIER AERO |
25.6 |
+2.5 |
8.0 |
-2.5 |
4.4 |
0.0 |
4.8 |
10.4 |
398 (16.6) |
48/14 |
| MOUNT ISA AERO |
36.0 |
+1.7 |
22.7 |
+0.9 |
20.6 |
0.0 |
11.4 |
9.3 |
319 (13.3) |
55/19 |
| CAIRNS AERO |
32.4 |
+1.9 |
25.0 |
+2.0 |
22.0 |
0.6 |
7.2 |
10.2 |
476 (19.8) |
41/15 |
| TOWNSVILLE AERO |
32.4 |
+1.7 |
24.4 |
+1.5 |
21.6 |
0.0 |
9.0 |
9.5 |
466 (19.4) |
37/13 |
| MACKAY M.O |
28.9 |
+0.3 |
23.6 |
+1.4 |
-- |
1.0 |
-- |
7.1 |
475 (19.8) |
43/10 |
| ROCKHAMPTON AERO |
32.1 |
+1.6 |
22.1 |
+1.3 |
20.8 |
0.0 |
7.6 |
-- |
376 (15.7) |
35/08 |
| BUNDABERG AERO |
31.0 |
+1.9 |
20.9 |
+1.0 |
-- |
1.4 |
8.8 |
-- |
470 (19.6) |
-- |
| NAMBOUR DPI |
28.0 |
+0.1 |
21.1 |
+2.9 |
-- |
31.82 |
10.0 |
-- |
136 ( 5.7) |
31/13 |
| COOLANGATTA |
26.1 |
-1.1 |
21.0 |
+1.4 |
-- |
26.4 |
-- |
-- |
473 (19.7) |
39/07 |
| BRISBANE AERO |
26.3 |
-1.7 |
21.3 |
+2.0 |
20.2 |
13.4 |
6.2 |
2.0 |
421 (17.5) |
35/13 |
| TOOWOOMBA AIRPORT |
23.4 |
-3.0 |
17.4 |
+1.3 |
-- |
1.2 |
-- |
-- |
690 (28.8) |
58/10 |
| GUNNEDAH RESOURCE CENTRE |
29.3 |
+0.2 |
16.5 |
-0.1 |
13.4 |
0.0 |
7.6 |
-- |
392 (16.3) |
-- |
| COFFS HARBOUR MO |
24.9 |
-1.0 |
18.0 |
-0.1 |
17.8 |
82.6 |
-- |
6.6 |
578 (24.1) |
45/03 |
| PORT MACQUARIE AIRPORT AWS |
26.2 |
-0.1 |
15.7 |
-1.0 |
-- |
1.0 |
-- |
-- |
-- |
-- |
| WILLIAMTOWN RAAF |
25.1 |
-1.1 |
14.4 |
-1.9 |
12.4 |
2.2 |
5.4 |
7.8 |
444 (18.5) |
35/00 |
| GOSFORD (NARARA RESEARCH STATION) AWS |
25.1 |
-0.9 |
15.0 |
-0.3 |
-- |
0.4 |
-- |
-- |
154 ( 6.4) |
21/13 |
| ORANGE AGRICULTURAL INSTITUTE |
20.0 |
-2.8 |
12.3 |
+1.7 |
9.4 |
0.0 |
5.6 |
2.3 |
-- |
-- |
| DUBBO AIRPORT AWS |
27.4 |
-1.7 |
17.0 |
+2.5 |
-- |
0.0 |
-- |
-- |
-- |
-- |
| SYDNEY AIRPORT AMO |
25.3 |
+0.1 |
18.3 |
+0.9 |
14.2 |
0.6 |
6.2 |
3.9 |
590 (24.6) |
34/16 |
| RICHMOND RAAF |
25.1 |
-1.8 |
16.4 |
+0.9 |
-- |
0.2 |
-- |
-- |
248 (10.3) |
28/16 |
| BELLAMBI AWS |
-- |
-- |
-- |
-- |
-- |
-- |
-- |
-- |
-- |
-- |
| CANBERRA AIRPORT |
26.3 |
+1.8 |
11.7 |
+1.0 |
9.3 |
0.0 |
6.6 |
10.5 |
398 (16.6) |
39/20 |
| WAGGA WAGGA AMO |
29.2 |
+1.5 |
17.1 |
+3.7 |
16.0 |
0.0 |
11.8 |
10.2 |
46 ( 1.9) |
-- |
| ALBURY AIRPORT AWS |
30.0 |
+2.1 |
13.7 |
+1.1 |
-- |
0.0 |
-- |
-- |
180 ( 7.5) |
35/11 |
| MILDURA AIRPORT |
33.0 |
+4.7 |
13.7 |
-0.1 |
16.1 |
0.0 |
6.6 |
9.0 |
349 (14.5) |
45/21 |
| TATURA INST SUSTAINABLE AG |
31.0 |
+4.7 |
12.8 |
+1.1 |
-- |
0.0 |
5.4 |
-- |
238 ( 9.9) |
50/00 |
| BENDIGO AIRPORT |
30.4 |
+4.4 |
12.2 |
+0.9 |
-- |
0.0 |
-- |
-- |
314 (13.1) |
�
41/14 |
| MELBOURNE REGIONAL OFFICE |
31.3 |
+7.4 |
14.6 |
+1.4 |
11.7 |
0.0 |
5.6 |
-- |
147 ( 6.1) |
41/13 |
| GEELONG AIRPORT |
32.3 |
+9.1 |
10.0 |
-1.8 |
-- |
0.0 |
-- |
-- |
423 (17.6) |
57/12 |
| BALLARAT AERODROME |
29.9 |
+7.7 |
8.6 |
-1.3 |
-- |
0.0 |
-- |
-- |
548 (22.8) |
55/09 |
| LAUNCESTON (TI TREE BEND) |
21.6 |
-0.9 |
7.8 |
-2.2 |
-- |
0.0 |
-- |
-- |
189 ( 7.9) |
43/21 |
| HOBART AIRPORT |
21.1 |
+0.4 |
8.4 |
-2.3 |
5.6 |
0.0 |
4.8 |
4.3 |
329 (13.7) |
39/23 |
| |
Max
°
C |
+/- norm
°
C |
Min
°
C |
+/- norm
°
C |
Grass Min
°
C |
Rain to 9am mm |
Evaporation to 9am mm |
Sunshine hours |
Wind Run to 9am km |
Maximum Gust km/h / hour of occurrence |
|
| Hottest |
| Highest maximum temperature> | Greatest variation above normal maximum |
Highest minimum temperature | Greatest variation above normal minimum |
46.4 KALBARRI Central West WA
46.0 SHARK BAY AIRPORT W Gascoyne WA
45.8 CARNARVON AIRPORT W Gascoyne WA
45.6 EMU CREEK STATION W Gascoyne WA
44.9 DENHAM W Gascoyne WA
|
+17.3 : 39.9 CAPE LEEUWIN Lower West WA
+16.6 : 40.7 ALBANY AIRPORT Lower West WA
+16.5 : 41.2 MANJIMUP Lower West WA
+16.3 : 41.0 SHANNON Lower West WA
|
31.7 PARABURDOO AERO E Gascoyne WA
30.6 WITTENOOM W Pilbara WA
29.8 MARBLE BAR E Pilbara WA
29.3 PORT HEDLAND AIRPORT E Pilbara WA
29.2 GASCOYNE JUNCTION W Gascoyne WA
|
+10.8 : 25.8 CAPE NATURALISTE Lower West WA
+9.5 : 28.5 KALBARRI Central West WA
+9.5 : 25.3 PEARCE RAAF Lower West WA
+9.0 : 21.4 MOUNT BARKER Lower West WA
+8.7 : 31.7 PARABURDOO AERO E Gascoyne WA
|
| Coldest |
| Lowest maximum temperature | Greatest variation below normal maximum |
Lowest minimum temperature | Greatest variation below normal minimum |
11.1 MOUNT WELLINGTON Southeast TAS
11.5 MOUNT READ W Coast TAS
14.0 THREDBO AWS Snowy Mtns NSW
14.5 MT HOTHAM Upper NE VIC
|
-9.2 : 24.0 DOONGAN N Kimberley WA
-7.7 : 25.9 KALUMBURU N Kimberley WA
-6.9 : 25.5 MOUNT ELIZABETH N Kimberley WA
-6.7 : 26.5 KURI BAY N Kimberley WA
-6.5 : 27.2 CYGNET BAY W Kimberley WA
|
0.8 LAKE ST CLAIR NATIONAL PARK Central Plateau TAS
1.1 TARRALEAH VILLAGE Derwent Valley TAS
1.5 MOUNT WELLINGTON Southeast TAS
2.0 PERISHER VALLEY SKI CENTRE Snowy Mtns NSW
2.1 THREDBO AWS Snowy Mtns NSW
|
-8.3 : 6.0 EYRE Eucla WA
-6.2 : 7.1 ROSEDALE (TURRETFIELD RESEARCH CENTRE) Adelaide/Lofty SA
-5.5 : 7.1 ROSEWORTHY AWS Adelaide/Lofty SA
-5.2 : 2.5 OUSE FIRE STATION Derwent Valley TAS
-5.1 : 7.6 WUDINNA AERO W Agricultural SA
|
|
Sunniest &
dullest |
Windiest |
Highest gusts |
Todays highest rainfall totals for the 24 hours to 9am. It
includes the top 5 totals nationally followed by all reported falls of 50mm or more. |
Highest
and lowest recordings of hours of sunshine for the 24 hours to midnight. |
Highest wind
run totals in kilometres for the 24 hours to 9am (average speed in brackets).
All reported runs >
=25km/h are shown. |
Highest wind
gusts in km/h for the 24 hours to midnight followed by the hour in which it occurred.
All stations with gusts >
89km/h are shown. |
112.8 TRUSCOTT N Kimberley WA
90.6 DORRIGO (OLD CORAMBA RD) MidNorth Coast N NSW
82.6 COFFS HARBOUR MO MidNorth Coast N NSW
80.8 CHRISTMAS ISLAND AERO Islands ISL
79.5 BARATRIA Northwest QLD
WESTERN AUSTRALIA
N Kimberley
112.8 TRUSCOTT
72.2 KALUMBURU
56.2 FARAWAY BAY
W Kimberley
60.0 ROEBUCK PLAINS
NORTHERN TERRITORY
N Rivers
66.6 WILDMAN RANGERS
QUEENSLAND
Central Highlands
53.6 JERICHO POST OFFICE
Central West
61.0 ROTHERFIELD
53.0 EVORA STATION
Northwest
79.5 BARATRIA
72.3 DENTON
63.0 WARRNAMBOOL DOWNS
55.0 MELROSE
Channel Country
74.4 REGLEIGH
Brisbane/SE Coast
62.0 NUMINBAH
58.4 GLENGAVEN
50.0 SPRINGBROOK ROAD
50.0 GLENVIEW - ISAMBERT RD
Warrego
60.0 HUNGERFORD
56.0 DERBYSHIRE DOWNS
51.2 WARIDA
NEW SOUTH WALES
Upper Darling
56.0 ENNGONIA (BELALIE)
52.0 ENNGONIA (SHEARER STREET)
North Coast
71.0 DOON DOON (MCCABES ROAD)
56.0 ROSEBANK (UPPER COOPERS CREEK)
55.0 COMMISSIONERS CREEK (BLUE RIDGE)
MidNorth Coast N
90.6 DORRIGO (OLD CORAMBA RD)
82.6 COFFS HARBOUR MO
71.0 PROMISED LAND (BELLINGEN (CRYSTAL CREEKS
61.7 CORAMBA (GLENFIDDICH)
60.2 URUNGA (SUNSET PLACE)
56.0 LEIGH (ROLLING ACRES)
50.4 UPPER ORARA (AURANIA)
ISLANDS
Islands
80.8 CHRISTMAS ISLAND AERO
|
12.0 ALBANY AIRPORT Lower West WA
11.8 GILES METEOROLOGICAL OFFICE Interior WA
11.8 ALICE SPRINGS AIRPORT N Plateau NT
11.7 PERTH AIRPORT Lower West WA
11.4 CEDUNA AMO W Agricultural SA
.....
2.0 BRISBANE AERO Brisbane/SE Coast QLD
1.1 DARWIN AIRPORT N Rivers NT
0.4 SCOTTSDALE (WEST MINSTONE ROAD) N Coast TAS
0.0 WARWICK Darling Downs E QLD
0.0 ALSTONVILLE TROPICAL FRUIT RESEARCH STAT North Coast NSW
|
1078 (44.9) WILSONS PROMONTORY LIGHTHOUSE W Gippsland VIC
1040 (43.3) CAPE MORETON LIGHTHOUSE Brisbane/SE Coast QLD
990 (41.3) HOGAN ISLAND Islands ISL
944 (39.3) BYRON BAY (CAPE BYRON AWS) North Coast NSW
916 (38.2) MURRURUNDI GAP AWS Hunter Valley NSW
896 (37.3) RUNDLE ISLAND Wide Bay/Burnett QLD
837 (34.9) HAMILTON ISLAND AIRPORT Central Coast E QLD
821 (34.2) GOLD COAST SEAWAY Brisbane/SE Coast QLD
796 (33.2) LADY ELLIOT ISLAND Wide Bay/Burnett QLD
766 (31.9) GLEN INNES AIRPORT AWS N Tablelands W NSW
756 (31.5) EVANS HEAD RAAF BOMBING RANGE AWS North Coast NSW
753 (31.4) CAPE WILLOUGHBY Yorke Pen/Kanga Is SA
747 (31.1) HERON ISLAND RES STN Wide Bay/Burnett QLD
736 (30.7) COLAC (MT GELLIBRAND) W Coast VIC
735 (30.6) DOUBLE ISLAND POINT LIGHTHOUSE Brisbane/SE Coast QLD
723 (30.1) LOW ISLES LIGHTHOUSE N Coast--Barron QLD
706 (29.4) NORAH HEAD AWS Hunter Valley NSW
690 (28.8) TOOWOOMBA AIRPORT Darling Downs E QLD
683 (28.5) MOUNT READ W Coast TAS
676 (28.2) CEDUNA AMO W Agricultural SA
663 (27.6) MOOMBA AIRPORT NE Pastoral SA
657 (27.4) WILLIS ISLAND Islands ISL
648 (27.0) TIBOOBURRA AIRPORT Far Northwest NSW
643 (26.8) PARAWA (SECOND VALLEY FOREST AWS) Adelaide/Lofty SA
642 (26.8) NEPTUNE ISLAND W Agricultural SA
639 (26.6) RHYLL E Central VIC
639 (26.6) NORFOLK ISLAND AERO Islands ISL
632 (26.3) OAKEY AERO Darling Downs E QLD
626 (26.1) EDITHBURGH Yorke Pen/Kanga Is SA
626 (26.1) CAPE OTWAY LIGHTHOUSE W Coast VIC
618 (25.8) HINDMARSH ISLAND AWS Adelaide/Lofty SA
618 (25.8) BOURKE AIRPORT AWS Upper Darling NSW
615 (25.6) MONTAGUE ISLAND LIGHTHOUSE South Coast NSW
611 (25.5) GUNNEDAH AIRPORT AWS NW Slopes S NSW
610 (25.4) STENHOUSE BAY Yorke Pen/Kanga Is SA
608 (25.3) NEWCASTLE NOBBYS SIGNAL STATION AWS Hunter Valley NSW
606 (25.3) NULLARBOR W Agricultural SA
605 (25.2) MAROOCHYDORE AERO Brisbane/SE Coast QLD
601 (25.0) CAPE FLATTERY N Coast--Barron QLD
600 (25.0) CAPE JAFFA (CURLEY HILLS) Lower SE SA
600 (25.0) CABRAMURRA SMHEA AWS SW Slopes S NSW
|
96/18 VARANUS ISLAND Islands ISL
95/22 MAATSUYKER ISLAND LIGHTHOUSE Southeast TAS
85/20 MOUNT READ W Coast TAS
81/20 MOUNT WELLINGTON Southeast TAS
80/20 CAPE GRIM BAPS N Coast TAS
80/21 SCOTTS PEAK DAM W Coast TAS
|
�