|
For notes on how to interpret
the data and quality control issues, see Daily Weather Summary Help.
**S** and **W** precede data flagged by the Bureau as suspicious or wrong
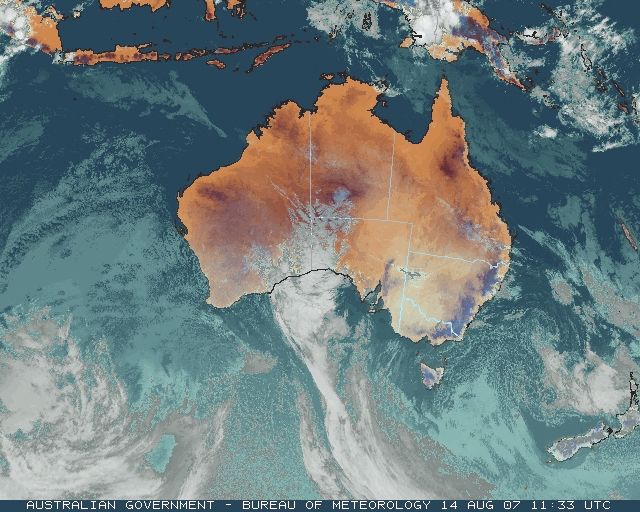
Data is as received at 01:05EST, 15/05/2012.
|
|
| |
Max
°
C |
+/- norm
°
C |
Min
°
C |
+/- norm
°
C |
Grass Min
°
C |
Rain to 9am mm |
Evaporation to 9am mm |
Sunshine hours |
Wind Run to 9am km (24-hour average km/h) |
Maximum Gust km/h / hour of occurrence |
| GERALDTON AIRPORT |
18.0 |
-2.0 |
11.5 |
+2.6 |
8.2 |
0.6 |
2.8 |
-- |
427 (17.8) |
48/13 |
| PERTH AIRPORT |
16.9 |
-1.5 |
8.4 |
+0.4 |
6.6 |
4.0 |
2.2 |
8.2 |
253 (10.5) |
45/15 |
| ALBANY AIRPORT |
14.4 |
-1.7 |
8.1 |
+0.6 |
4.7 |
6.6 |
2.8 |
7.8 |
294 (12.3) |
41/11 |
| BUNBURY |
16.0 |
-1.3 |
5.9 |
-1.7 |
-- |
10.6 |
-- |
-- |
175 ( 7.3) |
39/14 |
| MANDURAH |
15.8 |
-- |
11.3 |
-- |
-- |
10.6 |
-- |
-- |
238 ( 9.9) |
48/14 |
| DARWIN AIRPORT |
32.5 |
+1.2 |
21.3 |
+0.9 |
20.2 |
0.0 |
4.6 |
10.8 |
-- |
31/15 |
| ALICE SPRINGS AIRPORT |
27.3 |
+4.7 |
4.2 |
-1.8 |
0.7 |
0.0 |
7.2 |
11.0 |
315 (13.1) |
39/11 |
| WHYALLA AERO |
20.5 |
+2.0 |
-0.1 |
-6.0 |
-- |
0.0 |
4.6 |
-- |
251 (10.5) |
37/12 |
| ADELAIDE (KENT TOWN) |
16.2 |
-0.5 |
7.2 |
-1.0 |
1.7 |
0.0 |
2.2 |
10.3 |
258 (10.8) |
-- |
| MOUNT GAMBIER AERO |
13.0 |
-1.1 |
0.0 |
-5.5 |
-4.0 |
0.2 |
1.0 |
9.9 |
154 ( 6.4) |
30/15 |
| MOUNT ISA AERO |
28.7 |
+1.4 |
13.4 |
+3.1 |
8.6 |
0.0 |
8.2 |
10.9 |
383 (16.0) |
35/10 |
| CAIRNS AERO |
27.8 |
+1.2 |
19.9 |
+2.5 |
17.8 |
0.0 |
6.2 |
4.5 |
401 (16.7) |
34/13 |
| TOWNSVILLE AERO |
26.3 |
+0.3 |
17.2 |
+2.5 |
15.8 |
0.0 |
4.6 |
10.5 |
316 (13.2) |
35/14 |
| MACKAY M.O |
22.7 |
+0.2 |
16.7 |
+2.7 |
-- |
0.0 |
-- |
10.3 |
265 (11.0) |
30/09 |
| ROCKHAMPTON AERO |
26.0 |
+1.2 |
14.3 |
+3.7 |
11.5 |
0.0 |
3.4 |
-- |
162 ( 6.8) |
30/11 |
| BUNDABERG AERO |
24.6 |
+1.3 |
12.5 |
+1.6 |
-- |
0.0 |
3.0 |
-- |
242 (10.1) |
34/12 |
| NAMBOUR DPI |
23.1 |
+0.6 |
9.5 |
+1.5 |
-- |
0.0 |
2.8 |
-- |
56 ( 2.3) |
24/13 |
| COOLANGATTA |
22.2 |
+0.9 |
13.0 |
+2.6 |
-- |
0.0 |
-- |
-- |
266 (11.1) |
34/13 |
| BRISBANE AERO |
21.4 |
-0.4 |
12.4 |
+2.8 |
9.1 |
0.0 |
3.2 |
8.4 |
268 (11.2) |
35/12 |
| TOOWOOMBA AIRPORT |
18.9 |
+0.2 |
11.3 |
+3.8 |
-- |
0.0 |
-- |
-- |
524 (21.8) |
48/23 |
| GUNNEDAH RESOURCE CENTRE |
19.7 |
+1.8 |
8.8 |
+3.0 |
5.8 |
0.0 |
3.6 |
-- |
210 ( 8.8) |
-- |
| COFFS HARBOUR MO |
18.6 |
-1.2 |
13.2 |
+5.0 |
10.3 |
0.0 |
4.4 |
6.8 |
525 (21.9) |
35/09 |
| PORT MACQUARIE AIRPORT AWS |
16.6 |
-3.6 |
11.8 |
+5.1 |
-- |
0.0 |
-- |
-- |
-- |
-- |
| WILLIAMTOWN RAAF |
15.5 |
-3.1 |
6.7 |
-0.1 |
3.3 |
0.0 |
3.8 |
0.6 |
478 (19.9) |
30/00 |
| GOSFORD (NARARA RESEARCH STATION) AWS |
16.1 |
-2.9 |
5.0 |
-0.3 |
-- |
0.0 |
-- |
-- |
176 ( 7.3) |
22/13 |
| ORANGE AGRICULTURAL INSTITUTE |
10.6 |
-0.4 |
-0.8 |
-2.9 |
-4.3 |
0.0 |
0.6 |
10.0 |
-- |
-- |
| DUBBO AIRPORT AWS |
15.8 |
-1.7 |
2.4 |
-1.0 |
-- |
0.0 |
-- |
-- |
-- |
-- |
| SYDNEY AIRPORT AMO |
14.4 |
-3.9 |
6.4 |
-1.7 |
2.5 |
0.0 |
3.6 |
5.4 |
648 (27.0) |
43/13 |
| RICHMOND RAAF |
16.5 |
-3.3 |
2.5 |
-1.9 |
-- |
0.0 |
-- |
-- |
190 ( 7.9) |
41/12 |
| BELLAMBI AWS |
14.8 |
-3.2 |
7.5 |
-3.0 |
-- |
0.4 |
-- |
-- |
488 (20.3) |
46/12 |
| CANBERRA AIRPORT |
12.2 |
-0.8 |
0.5 |
-0.5 |
-3.2 |
0.0 |
2.6 |
7.9 |
274 (11.4) |
39/13 |
| WAGGA WAGGA AMO |
15.1 |
+0.6 |
0.9 |
-2.7 |
-2.4 |
0.0 |
1.8 |
9.3 |
167 ( 7.0) |
26/12 |
| ALBURY AIRPORT AWS |
14.7 |
-0.3 |
0.6 |
-3.2 |
-- |
0.0 |
-- |
-- |
104 ( 4.3) |
30/11 |
| MILDURA AIRPORT |
15.0 |
-2.2 |
-0.8 |
-6.0 |
-2.6 |
0.0 |
2.6 |
9.8 |
270 (11.3) |
22/13 |
| TATURA INST SUSTAINABLE AG |
14.7 |
0.0 |
-0.3 |
-4.2 |
-- |
0.0 |
2.2 |
-- |
347 (14.5) |
21/14 |
| BENDIGO AIRPORT |
13.1 |
-1.2 |
1.5 |
-1.0 |
-- |
0.0 |
-- |
-- |
386 (16.1) |
�
31/13 |
| MELBOURNE REGIONAL OFFICE |
15.5 |
+0.5 |
3.5 |
-3.2 |
1.6 |
1.2 |
1.4 |
-- |
149 ( 6.2) |
17/13 |
| GEELONG AIRPORT |
13.5 |
-1.5 |
2.1 |
-3.8 |
-- |
0.2 |
-- |
-- |
186 ( 7.8) |
31/09 |
| BALLARAT AERODROME |
12.1 |
+0.7 |
-0.4 |
-4.1 |
-- |
0.6 |
-- |
-- |
400 (16.7) |
35/05 |
| LAUNCESTON (TI TREE BEND) |
12.6 |
-1.1 |
-0.5 |
-4.1 |
-- |
0.0 |
-- |
-- |
238 ( 9.9) |
26/15 |
| HOBART AIRPORT |
11.1 |
-2.4 |
0.1 |
-4.6 |
-2.3 |
0.2 |
0.8 |
9.4 |
247 (10.3) |
24/03 |
| |
Max
°
C |
+/- norm
°
C |
Min
°
C |
+/- norm
°
C |
Grass Min
°
C |
Rain to 9am mm |
Evaporation to 9am mm |
Sunshine hours |
Wind Run to 9am km |
Maximum Gust km/h / hour of occurrence |
|
| Hottest |
| Highest maximum temperature> | Greatest variation above normal maximum |
Highest minimum temperature | Greatest variation above normal minimum |
36.5 MIDDLE POINT AWS N Rivers NT
36.3 WYNDHAM AERO N Kimberley WA
36.2 DOUGLAS RIVER N Rivers NT
36.2 KALUMBURU N Kimberley WA
36.0 WYNDHAM N Kimberley WA
36.0 KIMBERLEY RES.STATION E Kimberley WA
|
+9.0 : 28.2 EUCLA Eucla WA
+6.9 : 26.5 NULLARBOR W Agricultural SA
+6.8 : 27.7 FORREST Eucla WA
+6.6 : 29.6 WARBURTON AIRFIELD Interior WA
+6.0 : 24.7 CEDUNA AMO W Agricultural SA
+6.0 : 28.6 GILES METEOROLOGICAL OFFICE Interior WA
|
24.4 COCOS ISLAND AIRPORT Islands ISL
24.0 COCONUT ISLAND N Peninsula QLD
23.8 WILLIS ISLAND Islands ISL
23.6 HORN ISLAND N Peninsula QLD
23.4 MCCLUER ISLAND N Rivers NT
|
+8.0 : 16.6 LONGREACH AERO Central West QLD
+7.9 : 17.3 WINTON POST OFFICE Northwest QLD
+6.9 : 15.4 WATARRKA N Plateau NT
+6.6 : 14.6 ISISFORD POST OFFICE Central West QLD
+6.3 : 9.5 WARWICK Darling Downs E QLD
|
| Coldest |
| Lowest maximum temperature | Greatest variation below normal maximum |
Lowest minimum temperature | Greatest variation below normal minimum |
-2.2 THREDBO AWS Snowy Mtns NSW
-0.8 MT HOTHAM Upper NE VIC
0.0 MOUNT WELLINGTON Southeast TAS
0.5 MT BAW BAW W Gippsland VIC
0.6 CHARLOTTE PASS (KOSCIUSKO CHALET) Snowy Mtns NSW
|
-7.1 : 13.2 YARRAS (MOUNT SEAVIEW) MidNorth Coast S NSW
-6.0 : 14.0 TAREE AIRPORT AWS MidNorth Coast S NSW
-5.5 : 11.9 ULLADULLA AWS South Coast NSW
-5.4 : 8.0 BOWRAL (PARRY DRIVE) Illawarra NSW
-5.3 : 14.1 PATERSON (TOCAL AWS) Hunter Valley NSW
-5.3 : 13.0 MORUYA AIRPORT AWS South Coast NSW
|
-7.2 THREDBO AWS Snowy Mtns NSW
-7.1 LIAWENEE Central Plateau TAS
-7.0 PERISHER VALLEY SKI CENTRE Snowy Mtns NSW
-6.4 MT HOTHAM Upper NE VIC
-6.4 CHARLOTTE PASS (KOSCIUSKO CHALET) Snowy Mtns NSW
|
-8.5 : -4.7 YUNTA AIRSTRIP Northeast SA
-8.0 : -3.9 GLUEPOT RESERVE (GLUEPOT) Northeast SA
-7.8 : -3.5 RENMARK AERO Murray Valley SA
-7.6 : -2.1 CASTERTON SHOWGROUNDS W Coast VIC
-7.3 : -0.9 STRATHALBYN RACECOURSE Murray Valley SA
|
|
Sunniest &
dullest |
Windiest |
Highest gusts |
Todays highest rainfall totals for the 24 hours to 9am. It
includes the top 5 totals nationally followed by all reported falls of 50mm or more. |
Highest
and lowest recordings of hours of sunshine for the 24 hours to midnight. |
Highest wind
run totals in kilometres for the 24 hours to 9am (average speed in brackets).
All reported runs >
=25km/h are shown. |
Highest wind
gusts in km/h for the 24 hours to midnight followed by the hour in which it occurred.
All stations with gusts >
89km/h are shown. |
39.0 BALLINA (CROWLEY VILLAGE) North Coast NSW
28.0 BALLINA AIRPORT AWS North Coast NSW
18.4 CHEYNE BEACH Lower West WA
16.4 ALBANY Lower West WA
16.2 LITTLE GROVE Lower West WA
|
11.0 GOVE AIRPORT N Rivers NT
11.0 ALICE SPRINGS AIRPORT N Plateau NT
10.9 TENNANT CREEK AIRPORT N Plateau NT
10.9 MOUNT ISA AERO Gulf Country QLD
10.8 DARWIN AIRPORT N Rivers NT
.....
4.5 CAIRNS AERO N Coast--Barron QLD
3.5 WARWICK Darling Downs E QLD
1.6 KAIRI RESEARCH STATION N Coast--Barron QLD
0.6 WILLIAMTOWN RAAF Hunter Valley NSW
0.5 SCONE SCS Hunter Valley NSW
|
898 (37.4) MONTAGUE ISLAND LIGHTHOUSE South Coast NSW
821 (34.2) CAPE LEEUWIN Lower West WA
765 (31.9) HOGAN ISLAND Islands ISL
745 (31.0) WILLIS ISLAND Islands ISL
739 (30.8) GREEN CAPE AWS South Coast NSW
719 (30.0) NEWCASTLE NOBBYS SIGNAL STATION AWS Hunter Valley NSW
698 (29.1) EDDYSTONE POINT E Coast TAS
676 (28.2) NEPTUNE ISLAND W Agricultural SA
675 (28.1) NORAH HEAD AWS Hunter Valley NSW
655 (27.3) WILSONS PROMONTORY LIGHTHOUSE W Gippsland VIC
654 (27.3) VARANUS ISLAND Islands ISL
653 (27.2) MOUNT BULLER Upper NE VIC
648 (27.0) SYDNEY AIRPORT AMO Sydney--east NSW
641 (26.7) BARROW ISLAND AIRPORT W Pilbara WA
641 (26.7) NORTH ISLAND Central West WA
633 (26.4) THEVENARD ISLAND W Pilbara WA
628 (26.2) SWAN ISLAND E Coast TAS
616 (25.7) COCOS ISLAND AIRPORT Islands ISL
615 (25.6) CHRISTMAS ISLAND AERO Islands ISL
614 (25.6) MT HOTHAM Upper NE VIC
|
81/13 FORREST Eucla WA
78/22 MOUNT READ W Coast TAS
72/18 WILSONS PROMONTORY LIGHTHOUSE W Gippsland VIC
68/22 NEPTUNE ISLAND W Agricultural SA
67/05 ROTTNEST ISLAND Lower West WA
67/09 CABRAMURRA SMHEA AWS SW Slopes S NSW
|
�