|
For notes on how to interpret
the data and quality control issues, see Daily Weather Summary Help.
**S** and **W** precede data flagged by the Bureau as suspicious or wrong
Data is as received at 00:42EST, 15/05/2012.
|
|
| |
Max
°
C |
+/- norm
°
C |
Min
°
C |
+/- norm
°
C |
Grass Min
°
C |
Rain to 9am mm |
Evaporation to 9am mm |
Sunshine hours |
Wind Run to 9am km (24-hour average km/h) |
Maximum Gust km/h / hour of occurrence |
| GERALDTON AIRPORT |
24.7 |
+3.8 |
19.2 |
+8.2 |
14.9 |
0.0 |
13.8 |
-- |
741 (30.9) |
52/04 |
| PERTH AIRPORT |
24.3 |
+5.4 |
13.1 |
+4.1 |
10.5 |
1.2 |
3.2 |
4.7 |
666 (27.8) |
54/15 |
| ALBANY AIRPORT |
19.4 |
+2.8 |
10.9 |
+2.8 |
9.1 |
3.4 |
4.4 |
6.4 |
615 (25.6) |
63/12 |
| BUNBURY |
21.4 |
+3.0 |
12.5 |
+4.4 |
-- |
2.2 |
-- |
-- |
460 (19.2) |
54/15 |
| MANDURAH |
19.8 |
-- |
14.1 |
-- |
-- |
1.2 |
-- |
-- |
689 (28.7) |
59/13 |
| DARWIN AIRPORT |
32.8 |
+2.2 |
23.4 |
+3.5 |
22.6 |
0.0 |
6.6 |
10.2 |
404 (16.8) |
43/09 |
| ALICE SPRINGS AIRPORT |
16.3 |
-3.5 |
0.6 |
-4.5 |
-4.1 |
0.0 |
3.0 |
10.4 |
334 (13.9) |
39/10 |
| WHYALLA AERO |
15.7 |
-1.6 |
11.0 |
+4.9 |
-- |
0.3 |
5.3 |
-- |
450 (18.8) |
52/14 |
| ADELAIDE (KENT TOWN) |
15.6 |
-0.5 |
9.9 |
+1.8 |
7.4 |
1.2 |
0.4 |
5.5 |
197 ( 8.2) |
39/10 |
| MOUNT GAMBIER AERO |
13.7 |
-0.1 |
8.0 |
+2.2 |
5.2 |
2.6 |
1.8 |
2.9 |
404 (16.8) |
48/11 |
| MOUNT ISA AERO |
18.2 |
-6.7 |
8.0 |
-2.0 |
4.9 |
0.0 |
3.8 |
10.1 |
483 (20.1) |
45/01 |
| CAIRNS AERO |
25.3 |
-0.7 |
19.3 |
+1.5 |
18.6 |
7.4 |
2.6 |
5.8 |
480 (20.0) |
45/05 |
| TOWNSVILLE AERO |
19.2 |
-6.4 |
16.9 |
+2.3 |
16.4 |
25.0 |
4.4 |
0.2 |
325 (13.5) |
35/23 |
| MACKAY M.O |
19.0 |
-2.9 |
16.0 |
+2.0 |
-- |
32.6 |
-- |
0.0 |
476 (19.8) |
24/14 |
| ROCKHAMPTON AERO |
18.8 |
-4.7 |
16.2 |
+5.3 |
16.0 |
36.6 |
2.4 |
-- |
190 ( 7.9) |
26/12 |
| BUNDABERG AERO |
17.2 |
-5.4 |
16.0 |
+4.4 |
-- |
37.8 |
1.8 |
-- |
267 (11.1) |
26/08 |
| NAMBOUR DPI |
19.0 |
-2.6 |
14.8 |
+5.5 |
-- |
36.0 |
5.0 |
-- |
33 ( 1.4) |
18/10 |
| COOLANGATTA |
22.3 |
+1.2 |
15.7 |
+4.2 |
-- |
22.8 |
-- |
-- |
194 ( 8.1) |
35/08 |
| BRISBANE AERO |
20.4 |
-0.9 |
15.2 |
+4.7 |
14.7 |
22.8 |
3.2 |
0.8 |
372 (15.5) |
35/00 |
| TOOWOOMBA AIRPORT |
13.4 |
-3.6 |
11.4 |
+3.9 |
-- |
2.0 |
-- |
-- |
348 (14.5) |
28/10 |
| GUNNEDAH RESOURCE CENTRE |
-- |
-- |
11.2 |
+5.1 |
11.5 |
13.8 |
1.8 |
-- |
135 ( 5.6) |
-- |
| COFFS HARBOUR MO |
21.0 |
+1.6 |
14.8 |
+5.7 |
14.5 |
47.2 |
1.0 |
3.6 |
269 (11.2) |
59/15 |
| PORT MACQUARIE AIRPORT AWS |
18.1 |
-1.4 |
13.8 |
+5.8 |
-- |
8.0 |
-- |
-- |
-- |
-- |
| WILLIAMTOWN RAAF |
16.9 |
-0.7 |
9.5 |
+1.6 |
9.9 |
25.4 |
1.6 |
0.0 |
248 (10.3) |
59/23 |
| GOSFORD (NARARA RESEARCH STATION) AWS |
-- |
-- |
9.6 |
+3.1 |
-- |
59.0 |
-- |
-- |
49 ( 2.0) |
-- |
| ORANGE AGRICULTURAL INSTITUTE |
9.6 |
-0.9 |
6.8 |
+4.2 |
5.5 |
8.8 |
1.2 |
0.0 |
-- |
-- |
| DUBBO AIRPORT AWS |
14.2 |
-2.2 |
9.8 |
+5.2 |
-- |
28.0 |
-- |
-- |
-- |
-- |
| SYDNEY AIRPORT AMO |
17.9 |
+0.3 |
13.0 |
+4.5 |
7.1 |
26.2 |
3.0 |
0.5 |
304 (12.7) |
59/22 |
| RICHMOND RAAF |
12.2 |
-5.8 |
6.9 |
+2.0 |
-- |
17.2 |
-- |
-- |
49 ( 2.0) |
24/21 |
| BELLAMBI AWS |
17.6 |
-0.1 |
11.7 |
+0.7 |
-- |
0.8 |
-- |
-- |
255 (10.6) |
63/22 |
| CANBERRA AIRPORT |
12.0 |
-0.2 |
0.9 |
-0.1 |
-1.7 |
0.0 |
1.0 |
1.5 |
157 ( 6.5) |
34/06 |
| WAGGA WAGGA AMO |
14.0 |
+0.2 |
0.5 |
-3.2 |
-0.8 |
0.2 |
2.0 |
2.8 |
155 ( 6.5) |
26/18 |
| ALBURY AIRPORT AWS |
15.3 |
+1.1 |
1.4 |
-2.5 |
-- |
0.2 |
-- |
-- |
60 ( 2.5) |
26/23 |
| MILDURA AIRPORT |
14.1 |
-1.9 |
4.5 |
-0.7 |
4.2 |
0.0 |
1.8 |
1.7 |
296 (12.3) |
41/11 |
| TATURA INST SUSTAINABLE AG |
15.0 |
+1.0 |
2.3 |
-1.4 |
-- |
0.0 |
0.4 |
-- |
230 ( 9.6) |
28/23 |
| BENDIGO AIRPORT |
15.3 |
+2.1 |
5.2 |
+1.6 |
-- |
0.2 |
-- |
-- |
265 (11.0) |
�
45/11 |
| MELBOURNE REGIONAL OFFICE |
16.1 |
+2.1 |
10.7 |
+3.8 |
7.6 |
0.2 |
0.8 |
-- |
54 ( 2.3) |
26/14 |
| GEELONG AIRPORT |
14.7 |
+0.1 |
8.6 |
+2.3 |
-- |
1.8 |
-- |
-- |
321 (13.4) |
44/18 |
| BALLARAT AERODROME |
11.3 |
+0.5 |
6.6 |
+2.6 |
-- |
1.2 |
-- |
-- |
438 (18.3) |
48/19 |
| LAUNCESTON (TI TREE BEND) |
10.4 |
-2.7 |
1.6 |
-1.3 |
-- |
0.0 |
-- |
-- |
205 ( 8.5) |
44/01 |
| HOBART AIRPORT |
12.1 |
-0.8 |
5.8 |
+1.2 |
2.0 |
0.0 |
1.8 |
6.7 |
477 (19.9) |
30/03 |
| |
Max
°
C |
+/- norm
°
C |
Min
°
C |
+/- norm
°
C |
Grass Min
°
C |
Rain to 9am mm |
Evaporation to 9am mm |
Sunshine hours |
Wind Run to 9am km |
Maximum Gust km/h / hour of occurrence |
|
| Hottest |
| Highest maximum temperature> | Greatest variation above normal maximum |
Highest minimum temperature | Greatest variation above normal minimum |
33.5 MIDDLE POINT AWS N Rivers NT
33.0 SCHERGER RAAF N Peninsula QLD
33.0 DARWIN AIRPORT COMPARISON N Rivers NT
32.8 DARWIN AIRPORT N Rivers NT
32.8 KURI BAY N Kimberley WA
|
+6.4 : 23.8 WONGAN HILLS RES.STATION Central West WA
+6.1 : 24.0 NORTHAM Cent Wheatbelt WA
+6.0 : 24.1 WONGAN HILLS Central West WA
+6.0 : 25.0 CARNAMAH Central West WA
|
26.3 COCONUT ISLAND N Peninsula QLD
26.2 WARRUWI N Rivers NT
26.0 CAPE DON N Rivers NT
26.0 TROUGHTON ISLAND N Kimberley WA
25.9 COCOS ISLAND AIRPORT Islands ISL
|
+10.2 : 17.6 MURCHISON W Gascoyne WA
+9.0 : 9.0 WOOLBROOK (DANGLEMAH ROAD) NW Slopes S NSW
+9.0 : 22.0 LEARMONTH AIRPORT W Pilbara WA
+8.9 : 8.9 GLEN INNES AIRPORT AWS N Tablelands W NSW
+8.9 : 16.0 KEMPSEY (WIDE STREET) MidNorth Coast N NSW
|
| Coldest |
| Lowest maximum temperature | Greatest variation below normal maximum |
Lowest minimum temperature | Greatest variation below normal minimum |
0.6 MT HOTHAM Upper NE VIC
1.2 THREDBO AWS Snowy Mtns NSW
1.2 MOUNT WELLINGTON Southeast TAS
1.9 FALLS CREEK Upper NE VIC
2.4 MT BAW BAW W Gippsland VIC
|
-9.7 : 16.9 RICHMOND AIRPORT Upper Carpentaria QLD
-9.7 : 16.4 RICHMOND POST OFFICE Upper Carpentaria QLD
-9.2 : 7.9 COBAR AIRPORT AWS Upper Darling NSW
-8.3 : 8.2 COBAR MO Upper Darling NSW
-7.7 : 18.4 TOORAK RESEARCH STATION Gulf Country QLD
|
-11.0 CHARLOTTE PASS (KOSCIUSKO CHALET) Snowy Mtns NSW
-8.2 THREDBO VILLAGE Snowy Mtns NSW
-7.5 THREDBO AWS Snowy Mtns NSW
-5.7 COOMA AIRPORT AWS Goulburn/Monaro NSW
-5.0 COOMA VISITORS CENTRE Goulburn/Monaro NSW
|
-9.7 : -3.0 LIGHTNING RIDGE VISITORS INFORMATION CEN Upper Darling NSW
-8.3 : -1.4 EYRE Eucla WA
-6.6 : -1.1 KULGERA N Plateau NT
-5.9 : -11.0 CHARLOTTE PASS (KOSCIUSKO CHALET) Snowy Mtns NSW
-5.9 : 1.0 WATARRKA N Plateau NT
|
|
Sunniest &
dullest |
Windiest |
Highest gusts |
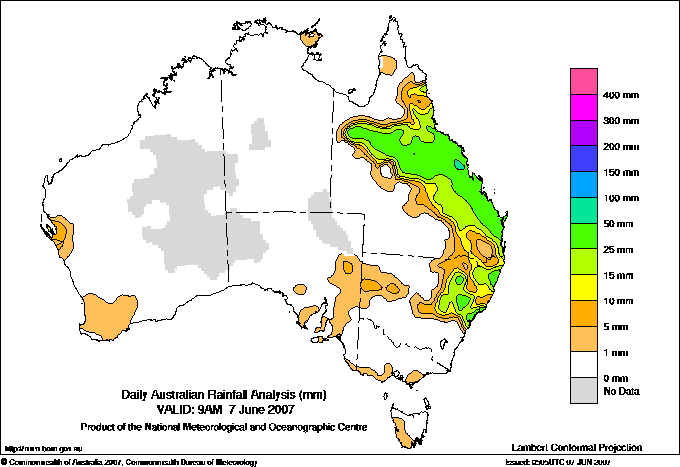
Todays highest rainfall totals for the 24 hours to 9am. It
includes the top 5 totals nationally followed by all reported falls of 50mm or more. |
Highest
and lowest recordings of hours of sunshine for the 24 hours to midnight. |
Highest wind
run totals in kilometres for the 24 hours to 9am (average speed in brackets).
All reported runs >
=25km/h are shown. |
Highest wind
gusts in km/h for the 24 hours to midnight followed by the hour in which it occurred.
All stations with gusts >
89km/h are shown. |
101.4 TAHLEE (CARRINGTON HOUSE) Hunter Valley NSW
92.0 MEREWETHER (BURWOOD BEACH WWTP) Hunter Valley NSW
90.8 SANDY CAPE LIGHTHOUSE Wide Bay/Burnett QLD
86.4 AVOCA BEACH BOWLING CLUB Hunter Valley NSW
82.0 NEWCASTLE NOBBYS SIGNAL STATION AWS Hunter Valley NSW
QUEENSLAND
Upper Carpentaria
64.0 CHILLAGOE ATHERTON STREET
56.2 ZARA STATION
55.0 KENMAC STATION
51.0 HILLVIEW STATION
Central Coast E
70.0 CREDITON
69.0 EUNGELLA NATIONAL PARK
68.0 DALRYMPLE HEIGHTS
56.4 BARNGANAL BLUE MOUNTAIN
56.0 ORKABIE WEST HILL
55.0 TE KOWAI EXP STN
54.0 KOUMALA HATFIELDS ROAD
54.0 LOWGLEN KARINGAL
51.2 SAMUEL HILL AERO
51.0 MIRANI WEIR ALERT
51.0 PLANE CREEK SUGAR MILL
50.4 NEBO SHIRE COUNCIL
Central Coast W
56.0 LANDSBOROUGH STATION
Wide Bay/Burnett
90.8 SANDY CAPE LIGHTHOUSE
52.2 LADY ELLIOT ISLAND
NEW SOUTH WALES
North Coast
82.0 MINNIE WATER PUMP SHED
MidNorth Coast N
50.2 WOOLGOOLGA (CLEAR PLACE)
MidNorth Coast S
51.0 HAWKS NEST (LANGI ST)
Hunter Valley
101.4 TAHLEE (CARRINGTON HOUSE)
92.0 MEREWETHER (BURWOOD BEACH WWTP)
86.4 AVOCA BEACH BOWLING CLUB
82.0 NEWCASTLE NOBBYS SIGNAL STATION AWS
72.2 GOSFORD NORTH (GLENNIE ST)
63.6 SWANSEA (CATHERINE ST)
59.0 GOSFORD (NARARA RESEARCH STATION) AWS
58.4 NELSON BAY (NELSON HEAD)
57.4 MERRIWA (ROSCOMMON)
55.0 MERRIWA (MAR-LEA)
52.2 NEWCASTLE UNIVERSITY
C Tablelands N
57.8 MERRIWA (MERRY VALE)
Sydney--east
68.4 WEST PYMBLE (WYUNA ROAD)
67.0 PENNANT HILLS (YARRARA ROAD)
50.2 RIVERVIEW OBSERVATORY
50.0 TURRAMURRA (KISSING POINT ROAD)
|
10.6 BROOME AIRPORT W Kimberley WA
10.6 RABBIT FLAT N Plateau NT
10.4 ALICE SPRINGS AIRPORT N Plateau NT
10.3 TENNANT CREEK AIRPORT N Plateau NT
10.2 DARWIN AIRPORT N Rivers NT
.....
0.0 MACKAY M.O Central Coast E QLD
0.0 COBAR MO Upper Darling NSW
0.0 WILLIAMTOWN RAAF Hunter Valley NSW
0.0 ORANGE AGRICULTURAL INSTITUTE C Tablelands S NSW
0.0 COWRA RESEARCH CENTRE (EVANS ST) C Tablelands S NSW
|
1185 (49.4) CAPE NATURALISTE Lower West WA
1099 (45.8) HOGAN ISLAND Islands ISL
1092 (45.5) MOUNT WELLINGTON Southeast TAS
1042 (43.4) MAATSUYKER ISLAND LIGHTHOUSE Southeast TAS
998 (41.6) CAPE GRIM BAPS N Coast TAS
980 (40.8) ROTTNEST ISLAND Lower West WA
970 (40.4) WILSONS PROMONTORY LIGHTHOUSE W Gippsland VIC
832 (34.7) CAPE WILLOUGHBY Yorke Pen/Kanga Is SA
817 (34.0) LOW ISLES LIGHTHOUSE N Coast--Barron QLD
793 (33.0) EDDYSTONE POINT E Coast TAS
791 (33.0) HAMILTON ISLAND AIRPORT Central Coast E QLD
772 (32.2) NEPTUNE ISLAND W Agricultural SA
741 (30.9) GERALDTON AIRPORT Central West WA
728 (30.3) CAPE BRUNY (CAPE BRUNY) Southeast TAS
717 (29.9) CAPE MORETON LIGHTHOUSE Brisbane/SE Coast QLD
707 (29.5) CAPE LEEUWIN Lower West WA
705 (29.4) MCCLUER ISLAND N Rivers NT
705 (29.4) VARANUS ISLAND Islands ISL
690 (28.8) LADY ELLIOT ISLAND Wide Bay/Burnett QLD
689 (28.7) MANDURAH Lower West WA
682 (28.4) HERON ISLAND RES STN Wide Bay/Burnett QLD
672 (28.0) CAPE FLATTERY N Coast--Barron QLD
671 (28.0) NORTH ISLAND Central West WA
668 (27.8) WILLIS ISLAND Islands ISL
667 (27.8) PARAWA (SECOND VALLEY FOREST AWS) Adelaide/Lofty SA
666 (27.8) PERTH AIRPORT Lower West WA
664 (27.7) NORMANTON AIRPORT Gulf Country QLD
663 (27.6) BURKETOWN AIRPORT Gulf Country QLD
659 (27.5) HINDMARSH ISLAND AWS Adelaide/Lofty SA
655 (27.3) STENHOUSE BAY Yorke Pen/Kanga Is SA
647 (27.0) PEARCE RAAF Lower West WA
640 (26.7) CUNDERDIN AIRFIELD Cent Wheatbelt WA
636 (26.5) MUNGLINUP WEST Goldfields WA
634 (26.4) HARTZ MOUNTAIN (KEOGHS PIMPLE) Southeast TAS
630 (26.3) LUCINDA POINT N Coast--Herbert QLD
626 (26.1) RUNDLE ISLAND Wide Bay/Burnett QLD
626 (26.1) TASMAN ISLAND Southeast TAS
615 (25.6) ALBANY AIRPORT Lower West WA
607 (25.3) JANDAKOT AERO Lower West WA
604 (25.2) DALWALLINU Central West WA
601 (25.0) BARROW ISLAND AIRPORT W Pilbara WA
|
85/00 CAPE NATURALISTE Lower West WA
83/13 CAPE LEEUWIN Lower West WA
76/22 MOUNT WELLINGTON Southeast TAS
76/19 HARTZ MOUNTAIN (KEOGHS PIMPLE) Southeast TAS
72/23 CABRAMURRA SMHEA AWS SW Slopes S NSW
72/00 EDDYSTONE POINT E Coast TAS
|
�