|
For notes on how to interpret
the data and quality control issues, see Daily Weather Summary Help.
**S** and **W** precede data flagged by the Bureau as suspicious or wrong
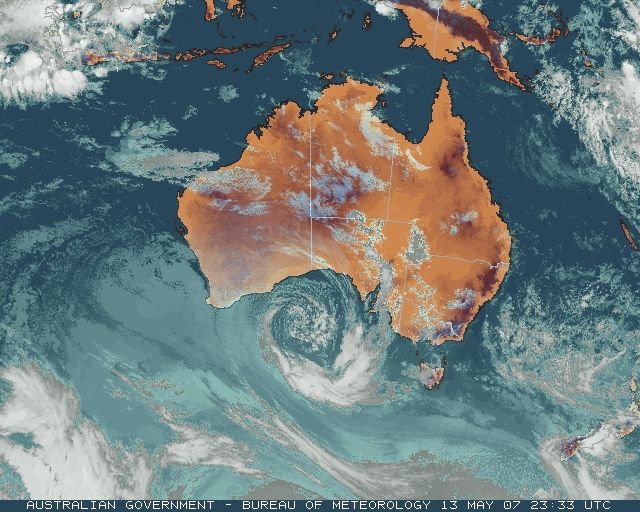
Data is as received at 00:35EST, 15/05/2012.
|
|
| |
Max
°
C |
+/- norm
°
C |
Min
°
C |
+/- norm
°
C |
Grass Min
°
C |
Rain to 9am mm |
Evaporation to 9am mm |
Sunshine hours |
Wind Run to 9am km (24-hour average km/h) |
Maximum Gust km/h / hour of occurrence |
| GERALDTON AIRPORT |
22.4 |
-1.6 |
15.8 |
+2.9 |
15.6 |
0.0 |
5.4 |
-- |
532 (22.2) |
43/14 |
| PERTH AIRPORT |
18.5 |
-3.2 |
5.9 |
-4.6 |
3.8 |
0.0 |
2.8 |
9.6 |
374 (15.6) |
35/10 |
| ALBANY AIRPORT |
14.8 |
-4.1 |
12.0 |
+2.2 |
9.0 |
0.0 |
2.2 |
0.2 |
375 (15.6) |
41/11 |
| BUNBURY |
18.5 |
-2.6 |
4.3 |
-5.2 |
-- |
0.0 |
-- |
-- |
213 ( 8.9) |
26/13 |
| MANDURAH |
17.3 |
-- |
9.4 |
-- |
-- |
0.0 |
-- |
-- |
313 (13.0) |
28/12 |
| DARWIN AIRPORT |
32.5 |
+0.5 |
24.0 |
+1.9 |
23.5 |
0.0 |
4.0 |
9.4 |
311 (13.0) |
34/09 |
| ALICE SPRINGS AIRPORT |
29.8 |
+6.8 |
12.2 |
+3.9 |
9.8 |
0.0 |
3.6 |
5.9 |
162 ( 6.8) |
46/16 |
| WHYALLA AERO |
25.9 |
+5.4 |
16.5 |
+7.8 |
-- |
0.4 |
4.4 |
-- |
337 (14.0) |
61/10 |
| ADELAIDE (KENT TOWN) |
24.9 |
+5.9 |
15.6 |
+5.4 |
12.8 |
0.0 |
5.6 |
3.1 |
223 ( 9.3) |
34/00 |
| MOUNT GAMBIER AERO |
23.8 |
+7.7 |
13.5 |
+6.2 |
11.7 |
0.0 |
1.4 |
6.8 |
368 (15.3) |
35/12 |
| MOUNT ISA AERO |
32.5 |
+4.6 |
19.6 |
+5.7 |
17.6 |
0.0 |
5.4 |
7.3 |
248 (10.3) |
34/12 |
| CAIRNS AERO |
28.6 |
+1.0 |
21.4 |
+1.5 |
20.2 |
2.2 |
4.4 |
9.3 |
410 (17.1) |
43/12 |
| TOWNSVILLE AERO |
29.7 |
+2.1 |
18.8 |
+1.2 |
17.5 |
0.8 |
4.4 |
10.2 |
293 (12.2) |
39/12 |
| MACKAY M.O |
24.8 |
+0.6 |
20.4 |
+3.3 |
-- |
5.8 |
-- |
9.6 |
448 (18.7) |
34/10 |
| ROCKHAMPTON AERO |
28.1 |
+2.1 |
17.0 |
+2.8 |
15.1 |
0.0 |
5.2 |
-- |
331 (13.8) |
28/08 |
| BUNDABERG AERO |
26.7 |
+2.0 |
16.7 |
+2.5 |
-- |
0.0 |
3.8 |
-- |
394 (16.4) |
34/13 |
| NAMBOUR DPI |
24.2 |
+0.5 |
17.3 |
+5.3 |
-- |
17.03 |
5.2 |
-- |
61 ( 2.5) |
48/01 |
| COOLANGATTA |
25.3 |
+2.2 |
16.8 |
+2.5 |
-- |
28.0 |
-- |
-- |
223 ( 9.3) |
30/15 |
| BRISBANE AERO |
25.3 |
+1.7 |
17.2 |
+4.4 |
15.2 |
0.4 |
2.8 |
8.6 |
275 (11.5) |
28/11 |
| TOOWOOMBA AIRPORT |
22.3 |
+2.3 |
13.3 |
+3.3 |
-- |
1.8 |
-- |
-- |
478 (19.9) |
41/21 |
| GUNNEDAH RESOURCE CENTRE |
24.6 |
+4.3 |
10.9 |
+2.2 |
6.2 |
0.0 |
2.6 |
-- |
55 ( 2.3) |
-- |
| COFFS HARBOUR MO |
22.4 |
+1.0 |
13.4 |
+1.7 |
12.7 |
4.4 |
0.6 |
9.5 |
180 ( 7.5) |
18/12 |
| PORT MACQUARIE AIRPORT AWS |
23.5 |
+2.0 |
13.0 |
+2.5 |
-- |
10.0 |
-- |
-- |
-- |
-- |
| WILLIAMTOWN RAAF |
23.8 |
+3.6 |
11.0 |
+0.9 |
10.2 |
0.2 |
0.2 |
6.3 |
185 ( 7.7) |
21/07 |
| GOSFORD (NARARA RESEARCH STATION) AWS |
23.8 |
+3.4 |
10.6 |
+2.3 |
-- |
0.2 |
-- |
-- |
30 ( 1.3) |
13/11 |
| ORANGE AGRICULTURAL INSTITUTE |
19.0 |
+4.8 |
5.6 |
+0.9 |
2.8 |
0.0 |
2.0 |
9.5 |
-- |
-- |
| DUBBO AIRPORT AWS |
23.9 |
+3.9 |
10.3 |
+3.5 |
-- |
0.0 |
-- |
-- |
-- |
-- |
| SYDNEY AIRPORT AMO |
24.8 |
+4.8 |
14.7 |
+3.8 |
11.4 |
0.0 |
3.8 |
8.6 |
320 (13.3) |
28/21 |
| RICHMOND RAAF |
23.0 |
+2.4 |
11.1 |
+3.2 |
-- |
0.0 |
-- |
-- |
71 ( 3.0) |
21/18 |
| BELLAMBI AWS |
22.2 |
+2.5 |
15.9 |
+2.8 |
-- |
0.0 |
-- |
-- |
291 (12.1) |
30/01 |
| CANBERRA AIRPORT |
21.4 |
+5.8 |
4.1 |
+0.9 |
0.3 |
0.0 |
2.4 |
9.1 |
149 ( 6.2) |
15/15 |
| WAGGA WAGGA AMO |
23.2 |
+5.9 |
9.5 |
+3.6 |
7.0 |
0.0 |
1.8 |
9.5 |
243 (10.1) |
15/02 |
| ALBURY AIRPORT AWS |
21.6 |
+3.9 |
9.0 |
+3.4 |
-- |
1.6 |
-- |
-- |
54 ( 2.3) |
17/14 |
| MILDURA AIRPORT |
28.3 |
+9.3 |
13.5 |
+6.1 |
10.5 |
0.0 |
3.2 |
7.9 |
225 ( 9.4) |
52/18 |
| TATURA INST SUSTAINABLE AG |
23.0 |
+5.7 |
10.3 |
+4.5 |
-- |
0.6 |
4.2 |
-- |
229 ( 9.5) |
24/11 |
| BENDIGO AIRPORT |
21.0 |
+4.4 |
10.1 |
+4.9 |
-- |
1.6 |
-- |
-- |
239 (10.0) |
�
34/17 |
| MELBOURNE REGIONAL OFFICE |
22.7 |
+6.0 |
13.1 |
+4.5 |
10.6 |
0.0 |
2.0 |
-- |
83 ( 3.5) |
18/15 |
| GEELONG AIRPORT |
22.5 |
+5.4 |
9.1 |
+1.4 |
-- |
0.0 |
-- |
-- |
86 ( 3.6) |
30/15 |
| BALLARAT AERODROME |
20.6 |
+7.0 |
11.9 |
+6.2 |
-- |
0.0 |
-- |
-- |
503 (21.0) |
39/09 |
| LAUNCESTON (TI TREE BEND) |
16.0 |
+0.2 |
6.2 |
+1.1 |
-- |
0.0 |
-- |
-- |
122 ( 5.1) |
43/09 |
| HOBART AIRPORT |
19.6 |
+4.4 |
5.7 |
-0.9 |
1.7 |
0.0 |
1.0 |
6.5 |
252 (10.5) |
26/15 |
| |
Max
°
C |
+/- norm
°
C |
Min
°
C |
+/- norm
°
C |
Grass Min
°
C |
Rain to 9am mm |
Evaporation to 9am mm |
Sunshine hours |
Wind Run to 9am km |
Maximum Gust km/h / hour of occurrence |
|
| Hottest |
| Highest maximum temperature> | Greatest variation above normal maximum |
Highest minimum temperature | Greatest variation above normal minimum |
36.6 FITZROY CROSSING AERO W Kimberley WA
36.5 WYNDHAM AERO N Kimberley WA
35.5 TIMBER CREEK N Rivers NT
35.5 KALUMBURU N Kimberley WA
35.4 BRADSHAW N Rivers NT
|
+9.3 : 28.3 MILDURA AIRPORT Mallee N VIC
+9.0 : 25.8 PORT FAIRY AWS W Coast VIC
+9.0 : 17.7 HARTZ MOUNTAIN (KEOGHS PIMPLE) Southeast TAS
+9.0 : 28.0 LAKE VICTORIA STORAGE Lower Darling NSW
+8.9 : 14.5 MOUNT WELLINGTON Southeast TAS
|
27.0 NORTHERN ENDEAVOUR Islands ISL
27.0 TROUGHTON ISLAND N Kimberley WA
26.0 MCCLUER ISLAND N Rivers NT
25.3 WARRUWI N Rivers NT
25.3 COCOS ISLAND AIRPORT Islands ISL
|
+11.0 : 16.4 YUNTA AIRSTRIP Northeast SA
+8.8 : 16.7 ROXBY DOWNS (OLYMPIC DAM AERODROME) NW Pastoral SA
+8.8 : 23.5 DOONGAN N Kimberley WA
+8.4 : 21.8 CAMOOWEAL TOWNSHIP Northwest QLD
+8.2 : 14.7 CLARE HIGH SCHOOL Lower North SA
+8.2 : 14.9 PADTHAWAY SOUTH Lower SE SA
|
| Coldest |
| Lowest maximum temperature | Greatest variation below normal maximum |
Lowest minimum temperature | Greatest variation below normal minimum |
7.9 MT HOTHAM Upper NE VIC
9.9 FALLS CREEK Upper NE VIC
10.0 MOUNT BULLER Upper NE VIC
10.6 MT BAW BAW W Gippsland VIC
11.0 THREDBO AWS Snowy Mtns NSW
|
-5.6 : 13.2 ROCKY GULLY Lower West WA
-5.5 : 14.8 ESPERANCE AERO Lower West WA
-5.1 : 17.2 DALWALLINU Central West WA
-5.1 : 17.9 GINGIN AERO Lower West WA
-5.1 : 15.4 ESPERANCE Lower West WA
-5.1 : 16.8 CUNDERDIN AIRFIELD Cent Wheatbelt WA
-5.1 : 15.1 WANDERING Cent Wheatbelt WA
|
-1.3 LIAWENEE Central Plateau TAS
-0.2 COOMA AIRPORT AWS Goulburn/Monaro NSW
0.0 COOMA VISITORS CENTRE Goulburn/Monaro NSW
|
-7.8 : 0.6 KELLERBERRIN Cent Wheatbelt WA
-6.5 : 3.0 JANDAKOT AERO Lower West WA
-6.4 : 2.4 PINGELLY Cent Wheatbelt WA
-6.3 : 1.6 BEVERLEY Cent Wheatbelt WA
-6.1 : 1.6 BROOKTON Cent Wheatbelt WA
|
|
Sunniest &
dullest |
Windiest |
Highest gusts |
Todays highest rainfall totals for the 24 hours to 9am. It
includes the top 5 totals nationally followed by all reported falls of 50mm or more. |
Highest
and lowest recordings of hours of sunshine for the 24 hours to midnight. |
Highest wind
run totals in kilometres for the 24 hours to 9am (average speed in brackets).
All reported runs >
=25km/h are shown. |
Highest wind
gusts in km/h for the 24 hours to midnight followed by the hour in which it occurred.
All stations with gusts >
89km/h are shown. |
45.0 BULMAN AWS N Rivers NT
37.7 NGUKURR N Rivers NT
37.0 TWEED HEADS GOLF CLUB North Coast NSW
31.0 CAPE WILBERFORCE N Rivers NT
29.0 CLEVE (BENMATAR) W Agricultural SA
|
10.6 BROOME AIRPORT W Kimberley WA
10.4 MOREE AERO NW Plains E NSW
10.3 COBAR MO Upper Darling NSW
10.2 TOWNSVILLE AERO N Coast--Herbert QLD
10.1 WARWICK Darling Downs E QLD
.....
3.1 ADELAIDE (KENT TOWN) Adelaide/Lofty SA
2.9 MELBOURNE AIRPORT E Central VIC
2.8 BUNDOORA (LATROBE UNIVERSITY) E Central VIC
2.3 ALSTONVILLE TROPICAL FRUIT RESEARCH STAT North Coast NSW
0.2 ALBANY AIRPORT Lower West WA
|
788 (32.8) RUNDLE ISLAND Wide Bay/Burnett QLD
759 (31.6) WILLIS ISLAND Islands ISL
753 (31.4) ROTTNEST ISLAND Lower West WA
720 (30.0) HOPETOUN NORTH Lower West WA
703 (29.3) NEPTUNE ISLAND W Agricultural SA
682 (28.4) CAPE FLATTERY N Coast--Barron QLD
673 (28.0) LOW ISLES LIGHTHOUSE N Coast--Barron QLD
662 (27.6) CAPE LEEUWIN Lower West WA
624 (26.0) LORD HOWE ISLAND AERO Islands ISL
620 (25.8) CARNARVON AIRPORT W Gascoyne WA
605 (25.2) KILMORE GAP N Central VIC
|
76/20 EDITHBURGH Yorke Pen/Kanga Is SA
76/20 CAPE WILLOUGHBY Yorke Pen/Kanga Is SA
61/14 WYNDHAM AERO N Kimberley WA
61/16 ESPERANCE AERO Lower West WA
61/16 HOPETOUN NORTH Lower West WA
61/09 CLEVE AERODROME W Agricultural SA
61/10 WHYALLA AERO W Agricultural SA
61/12 MINLATON AERO Yorke Pen/Kanga Is SA
61/22 WILLIS ISLAND Islands ISL
|
�