|
For notes on how to interpret
the data and quality control issues, see Daily Weather Summary Help.
**S** and **W** precede data flagged by the Bureau as suspicious or wrong
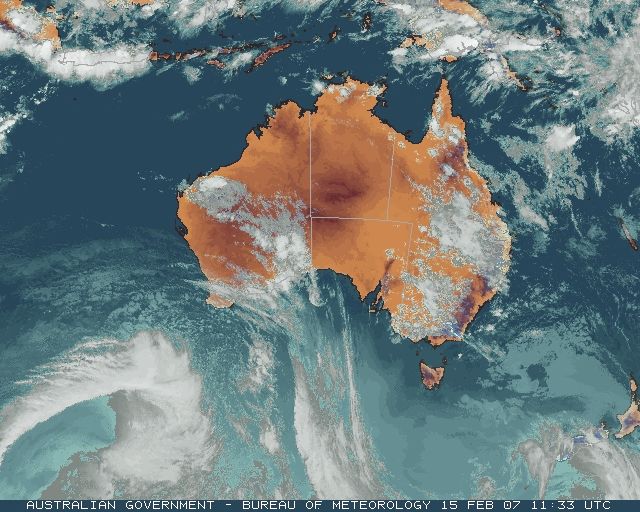
Data is as received at 00:06EST, 15/05/2012.
|
|
| |
Max
°
C |
+/- norm
°
C |
Min
°
C |
+/- norm
°
C |
Grass Min
°
C |
Rain to 9am mm |
Evaporation to 9am mm |
Sunshine hours |
Wind Run to 9am km (24-hour average km/h) |
Maximum Gust km/h / hour of occurrence |
| GERALDTON AIRPORT |
26.8 |
-5.7 |
19.2 |
+0.1 |
18.4 |
0.0 |
8.8 |
-- |
666 (27.8) |
50/14 |
| PERTH AIRPORT |
25.5 |
-6.3 |
13.8 |
-3.6 |
12.7 |
0.0 |
8.4 |
6.1 |
362 (15.1) |
50/13 |
| ALBANY AIRPORT |
22.8 |
-2.1 |
12.4 |
-2.0 |
7.3 |
0.0 |
8.0 |
7.1 |
354 (14.8) |
54/17 |
| BUNBURY |
23.6 |
-6.2 |
14.8 |
-0.8 |
-- |
0.4 |
-- |
-- |
321 (13.4) |
44/14 |
| MANDURAH |
23.0 |
-- |
18.6 |
-- |
-- |
0.0 |
-- |
-- |
323 (13.5) |
43/15 |
| DARWIN AIRPORT |
33.3 |
+1.9 |
24.7 |
0.0 |
25.7 |
0.2 |
4.0 |
8.8 |
322 (13.4) |
34/15 |
| ALICE SPRINGS AIRPORT |
38.7 |
+3.6 |
18.8 |
-2.0 |
15.6 |
0.0 |
14.0 |
12.5 |
344 (14.3) |
37/13 |
| WHYALLA AERO |
35.0 |
+5.4 |
18.5 |
+0.8 |
-- |
0.0 |
-- |
-- |
496 (20.7) |
30/02 |
| ADELAIDE (KENT TOWN) |
37.0 |
+7.7 |
19.9 |
+2.8 |
16.0 |
0.0 |
7.6 |
12.6 |
180 ( 7.5) |
34/13 |
| MOUNT GAMBIER AERO |
36.1 |
+11.0 |
12.0 |
+0.4 |
10.2 |
0.0 |
5.2 |
10.8 |
385 (16.0) |
41/16 |
| MOUNT ISA AERO |
38.6 |
+3.3 |
20.9 |
-2.5 |
17.6 |
0.0 |
11.2 |
10.4 |
267 (11.1) |
32/13 |
| CAIRNS AERO |
30.1 |
-1.1 |
23.3 |
-0.4 |
21.9 |
22.0 |
4.0 |
5.6 |
188 ( 7.8) |
37/11 |
| TOWNSVILLE AERO |
29.3 |
-1.8 |
22.3 |
-1.8 |
21.8 |
20.6 |
9.0 |
4.3 |
425 (17.7) |
35/02 |
| MACKAY M.O |
28.9 |
-0.7 |
20.9 |
-2.5 |
-- |
24.6 |
-- |
5.7 |
358 (14.9) |
43/01 |
| ROCKHAMPTON AERO |
30.2 |
-1.1 |
21.1 |
-1.0 |
20.0 |
0.0 |
6.0 |
-- |
314 (13.1) |
43/15 |
| BUNDABERG AERO |
27.0 |
-2.9 |
-- |
-- |
-- |
4.4 |
5.0 |
-- |
332 (13.8) |
-- |
| NAMBOUR DPI |
25.8 |
-3.0 |
18.5 |
-1.2 |
-- |
24.0 |
5.6 |
-- |
98 ( 4.1) |
37/14 |
| COOLANGATTA |
28.4 |
+0.2 |
19.0 |
-1.8 |
-- |
1.0 |
-- |
-- |
229 ( 9.5) |
30/12 |
| BRISBANE AERO |
28.0 |
-1.1 |
19.6 |
-1.5 |
18.2 |
3.8 |
5.4 |
7.9 |
314 (13.1) |
35/16 |
| TOOWOOMBA AIRPORT |
25.7 |
-1.7 |
17.1 |
-0.5 |
-- |
14.4 |
-- |
-- |
585 (24.4) |
46/15 |
| GUNNEDAH RESOURCE CENTRE |
32.8 |
+1.7 |
17.7 |
-0.9 |
13.0 |
0.0 |
7.8 |
-- |
145 ( 6.0) |
-- |
| COFFS HARBOUR MO |
27.3 |
+0.5 |
17.9 |
-1.6 |
17.0 |
1.8 |
4.8 |
9.2 |
244 (10.2) |
39/19 |
| PORT MACQUARIE AIRPORT AWS |
27.7 |
+0.2 |
16.9 |
-1.4 |
-- |
0.0 |
-- |
-- |
-- |
-- |
| WILLIAMTOWN RAAF |
26.9 |
-0.6 |
14.3 |
-3.8 |
13.8 |
0.0 |
6.2 |
11.0 |
255 (10.6) |
39/15 |
| GOSFORD (NARARA RESEARCH STATION) AWS |
27.0 |
-0.1 |
14.1 |
-3.0 |
-- |
0.0 |
-- |
-- |
92 ( 3.8) |
-- |
| ORANGE AGRICULTURAL INSTITUTE |
26.6 |
+0.8 |
12.1 |
-1.0 |
7.9 |
0.0 |
5.6 |
8.0 |
-- |
-- |
| DUBBO AIRPORT AWS |
32.7 |
+0.7 |
17.7 |
0.0 |
-- |
0.0 |
-- |
-- |
-- |
-- |
| SYDNEY AIRPORT AMO |
26.7 |
+0.4 |
19.2 |
+0.2 |
15.6 |
0.0 |
6.0 |
11.8 |
315 (13.1) |
39/15 |
| RICHMOND RAAF |
29.2 |
+0.2 |
15.9 |
-1.7 |
-- |
0.2 |
-- |
-- |
123 ( 5.1) |
34/15 |
| BELLAMBI AWS |
26.2 |
+1.4 |
17.9 |
-1.2 |
-- |
0.0 |
-- |
-- |
181 ( 7.5) |
22/18 |
| CANBERRA AIRPORT |
29.8 |
+2.7 |
13.6 |
+0.5 |
11.2 |
3.6 |
5.2 |
12.2 |
225 ( 9.4) |
34/15 |
| WAGGA WAGGA AMO |
34.2 |
+3.3 |
19.0 |
+2.7 |
17.7 |
0.0 |
8.8 |
11.6 |
268 (11.2) |
61/18 |
| ALBURY AIRPORT AWS |
33.6 |
+2.3 |
17.2 |
+1.1 |
-- |
4.8 |
-- |
-- |
145 ( 6.0) |
46/17 |
| MILDURA AIRPORT |
35.5 |
+3.9 |
20.6 |
+4.2 |
18.5 |
0.0 |
10.4 |
11.4 |
305 (12.7) |
45/12 |
| TATURA INST SUSTAINABLE AG |
34.3 |
+4.8 |
17.2 |
+2.9 |
-- |
1.4 |
8.4 |
-- |
273 (11.4) |
34/20 |
| BENDIGO AIRPORT |
34.4 |
+5.0 |
17.3 |
+3.2 |
-- |
0.0 |
-- |
-- |
277 (11.5) |
�
43/18 |
| MELBOURNE REGIONAL OFFICE |
35.3 |
+9.5 |
19.3 |
+4.7 |
17.4 |
0.0 |
5.8 |
-- |
122 ( 5.1) |
24/19 |
| GEELONG AIRPORT |
32.5 |
+7.5 |
16.1 |
+2.7 |
-- |
0.0 |
-- |
-- |
288 (12.0) |
35/14 |
| BALLARAT AERODROME |
33.0 |
+8.0 |
15.8 |
+4.4 |
-- |
0.0 |
-- |
-- |
341 (14.2) |
37/20 |
| LAUNCESTON (TI TREE BEND) |
29.5 |
+5.1 |
16.0 |
+4.0 |
-- |
0.0 |
-- |
-- |
191 ( 8.0) |
34/15 |
| HOBART AIRPORT |
26.3 |
+4.0 |
17.4 |
+5.4 |
17.2 |
0.0 |
5.4 |
11.1 |
414 (17.3) |
34/13 |
| |
Max
°
C |
+/- norm
°
C |
Min
°
C |
+/- norm
°
C |
Grass Min
°
C |
Rain to 9am mm |
Evaporation to 9am mm |
Sunshine hours |
Wind Run to 9am km |
Maximum Gust km/h / hour of occurrence |
|
| Hottest |
| Highest maximum temperature> | Greatest variation above normal maximum |
Highest minimum temperature | Greatest variation above normal minimum |
47.1 MARBLE BAR E Pilbara WA
46.5 CARNEGIE Interior WA
45.8 WITTENOOM W Pilbara WA
45.7 PARABURDOO AERO E Gascoyne WA
|
+15.1 : 41.5 EYRE Eucla WA
+11.9 : 43.7 BALGAIR Eucla WA
+11.0 : 36.1 MOUNT GAMBIER AERO Lower SE SA
+10.2 : 37.7 STRATHALBYN RACECOURSE Murray Valley SA
+9.9 : 35.4 ESSENDON AIRPORT E Central VIC
|
32.0 WILUNA Interior WA
30.6 ONSLOW W Pilbara WA
30.5 ONSLOW AIRPORT W Pilbara WA
29.3 CARNEGIE Interior WA
29.2 GASCOYNE JUNCTION W Gascoyne WA
|
+10.0 : 32.0 WILUNA Interior WA
+7.0 : 17.0 BUSHY PARK (BUSHY PARK ESTATES) Derwent Valley TAS
+6.9 : 22.2 WALPEUP RESEARCH Mallee N VIC
+6.7 : 17.8 SCOTTSDALE (WEST MINSTONE ROAD) N Coast TAS
+6.6 : 20.6 KUITPO FOREST RESERVE Adelaide/Lofty SA
+6.6 : 28.6 WARBURTON AIRFIELD Interior WA
+6.6 : 29.3 CARNEGIE Interior WA
|
| Coldest |
| Lowest maximum temperature | Greatest variation below normal maximum |
Lowest minimum temperature | Greatest variation below normal minimum |
17.3 MOUNT WELLINGTON Southeast TAS
17.6 TASMAN ISLAND Southeast TAS
17.8 FALLS CREEK Upper NE VIC
17.9 THREDBO AWS Snowy Mtns NSW
18.0 MT HOTHAM Upper NE VIC
|
-8.9 : 21.6 KARNET Lower West WA
-8.5 : 21.0 DWELLINGUP Lower West WA
-7.4 : 23.0 BICKLEY Lower West WA
-7.4 : 25.4 GOSNELLS CITY Lower West WA
-6.7 : 24.5 MEDINA RESEARCH CENTRE Lower West WA
|
4.0 PERISHER VALLEY SKI CENTRE Snowy Mtns NSW
6.2 THREDBO AWS Snowy Mtns NSW
6.8 THREDBO VILLAGE Snowy Mtns NSW
9.3 KAROONDA Mallee/Upper SE SA
|
-6.2 : 9.8 NULLARBOR W Agricultural SA
-6.1 : 17.5 RABBIT FLAT N Plateau NT
-5.3 : 16.8 YUENDUMU N Plateau NT
-4.9 : 19.7 TIMBER CREEK N Rivers NT
-4.5 : 10.5 CEDUNA AMO W Agricultural SA
-4.5 : 17.2 TERRITORY GRAPE FARM N Plateau NT
|
|
Sunniest &
dullest |
Windiest |
Highest gusts |
Todays highest rainfall totals for the 24 hours to 9am. It
includes the top 5 totals nationally followed by all reported falls of 50mm or more. |
Highest
and lowest recordings of hours of sunshine for the 24 hours to midnight. |
Highest wind
run totals in kilometres for the 24 hours to 9am (average speed in brackets).
All reported runs >
=25km/h are shown. |
Highest wind
gusts in km/h for the 24 hours to midnight followed by the hour in which it occurred.
All stations with gusts >
89km/h are shown. |
79.0 MT DOUGLAS Central Coast W QLD
72.6 PINNACLE S Peninsula QLD
65.0 MIRANI WEIR ALERT Central Coast E QLD
64.0 BABINDA SUGAR MILL N Coast--Barron QLD
63.0 MIRANI WEIR TM Central Coast E QLD
QUEENSLAND
N Peninsula
58.0 MERLUNA
S Peninsula
72.6 PINNACLE
N Coast--Barron
64.0 BABINDA SUGAR MILL
Central Coast E
65.0 MIRANI WEIR ALERT
63.0 MIRANI WEIR TM
Central Coast W
79.0 MT DOUGLAS
Central Highlands
53.6 THE SANDSTONE
Central West
58.0 BULLIWALLAH
53.0 EVORA STATION
Warrego
54.2 VICTORIA DOWNS
53.8 ANGELLALA DOWNS HOMESTEAD
|
12.7 ADELAIDE AIRPORT Adelaide/Lofty SA
12.6 ADELAIDE (KENT TOWN) Adelaide/Lofty SA
12.5 TENNANT CREEK AIRPORT N Plateau NT
12.5 ALICE SPRINGS AIRPORT N Plateau NT
12.4 WOOMERA AERODROME NW Pastoral SA
12.4 EAST SALE AIRPORT W Gippsland VIC
.....
5.7 MACKAY M.O Central Coast E QLD
5.6 CAIRNS AERO N Coast--Barron QLD
4.9 LAKE LEAKE (ELIZABETH RIVER) E Coast TAS
4.5 INVERELL RESEARCH CENTRE N Tablelands W NSW
4.3 TOWNSVILLE AERO N Coast--Herbert QLD
|
845 (35.2) RUNDLE ISLAND Wide Bay/Burnett QLD
758 (31.6) LADY ELLIOT ISLAND Wide Bay/Burnett QLD
715 (29.8) CARNARVON AIRPORT W Gascoyne WA
704 (29.3) NORTH ISLAND Central West WA
702 (29.3) DOUBLE ISLAND POINT LIGHTHOUSE Brisbane/SE Coast QLD
672 (28.0) CAPE MORETON LIGHTHOUSE Brisbane/SE Coast QLD
666 (27.8) GERALDTON AIRPORT Central West WA
661 (27.5) CAPE JAFFA (CURLEY HILLS) Lower SE SA
649 (27.0) SHARK BAY AIRPORT W Gascoyne WA
639 (26.6) EDITHBURGH Yorke Pen/Kanga Is SA
633 (26.4) HERON ISLAND RES STN Wide Bay/Burnett QLD
622 (25.9) CAPE GRIM BAPS N Coast TAS
609 (25.4) CAPE WILLOUGHBY Yorke Pen/Kanga Is SA
601 (25.0) NEPTUNE ISLAND W Agricultural SA
|
85/14 WINTON AIRPORT Northwest QLD
83/23 ONSLOW AIRPORT W Pilbara WA
80/13 LAUNCESTON AIRPORT COMPARISON N Coast TAS
76/22 MOUNT READ W Coast TAS
68/14 LEINSTER AERO Goldfields WA
68/17 EILDON FIRE TOWER N Central VIC
68/10 CAPE GRIM BAPS N Coast TAS
|
�