|
For notes on how to interpret
the data and quality control issues, see Daily Weather Summary Help.
**S** and **W** precede data flagged by the Bureau as suspicious or wrong
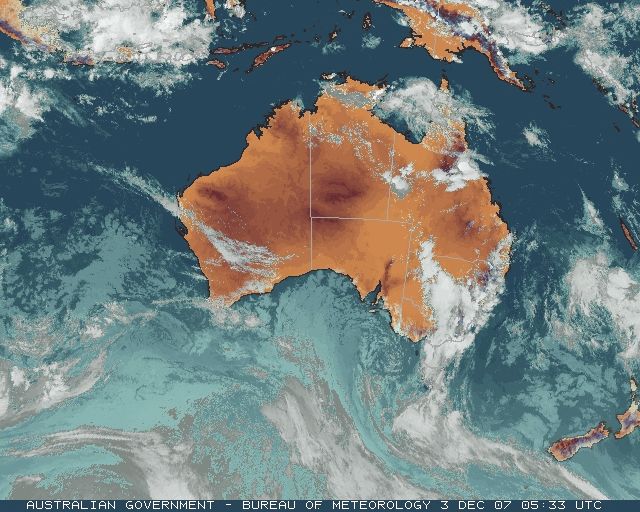
Data is as received at 01:39EST, 15/05/2012.
|
|
| |
Max
°
C |
+/- norm
°
C |
Min
°
C |
+/- norm
°
C |
Grass Min
°
C |
Rain to 9am mm |
Evaporation to 9am mm |
Sunshine hours |
Wind Run to 9am km (24-hour average km/h) |
Maximum Gust km/h / hour of occurrence |
| GERALDTON AIRPORT |
26.2 |
-3.3 |
15.0 |
-1.3 |
14.2 |
0.0 |
10.2 |
-- |
756 (31.5) |
59/16 |
| PERTH AIRPORT |
25.1 |
-3.8 |
10.2 |
-4.6 |
9.1 |
0.0 |
7.6 |
13.2 |
449 (18.7) |
48/15 |
| ALBANY AIRPORT |
18.8 |
-4.3 |
10.5 |
-1.9 |
8.0 |
2.0 |
4.0 |
6.3 |
-- |
39/10 |
| BUNBURY |
22.1 |
-5.0 |
8.1 |
-5.2 |
-- |
0.0 |
-- |
-- |
251 (10.5) |
44/15 |
| MANDURAH |
21.6 |
-- |
13.7 |
-- |
-- |
0.0 |
-- |
-- |
401 (16.7) |
46/14 |
| DARWIN AIRPORT |
35.2 |
+2.6 |
29.7 |
+4.4 |
29.1 |
0.0 |
10.2 |
7.1 |
691 (28.8) |
50/11 |
| ALICE SPRINGS AIRPORT |
35.0 |
-0.4 |
22.9 |
+2.7 |
20.7 |
0.0 |
12.2 |
12.9 |
296 (12.3) |
41/07 |
| WHYALLA AERO |
23.3 |
-4.8 |
12.0 |
-3.8 |
-- |
1.4 |
-- |
-- |
352 (14.7) |
39/17 |
| ADELAIDE (KENT TOWN) |
22.7 |
-4.3 |
16.2 |
+0.7 |
14.2 |
0.0 |
21.4 |
-- |
335 (14.0) |
39/16 |
| MOUNT GAMBIER AERO |
20.7 |
-2.2 |
12.4 |
+2.5 |
11.0 |
1.0 |
5.4 |
11.3 |
388 (16.2) |
54/16 |
| MOUNT ISA AERO |
42.0 |
+4.8 |
24.7 |
+1.6 |
22.2 |
0.0 |
11.8 |
8.9 |
312 (13.0) |
95/15 |
| CAIRNS AERO |
31.9 |
+0.5 |
25.5 |
+2.1 |
22.3 |
3.8 |
8.4 |
9.2 |
329 (13.7) |
55/22 |
| TOWNSVILLE AERO |
29.6 |
-1.9 |
24.7 |
+0.6 |
23.3 |
0.0 |
10.0 |
3.4 |
591 (24.6) |
41/02 |
| MACKAY M.O |
28.4 |
-1.7 |
21.2 |
-1.7 |
-- |
0.0 |
-- |
11.3 |
426 (17.8) |
32/00 |
| ROCKHAMPTON AERO |
29.6 |
-2.5 |
16.4 |
-4.8 |
15.4 |
0.0 |
6.2 |
-- |
303 (12.6) |
34/13 |
| BUNDABERG AERO |
29.2 |
-0.2 |
18.1 |
-2.4 |
-- |
0.0 |
4.0 |
-- |
440 (18.3) |
39/12 |
| NAMBOUR DPI |
26.8 |
-2.4 |
15.5 |
-2.7 |
-- |
14.43 |
-- |
-- |
113 ( 4.7) |
28/11 |
| COOLANGATTA |
26.9 |
-0.3 |
17.5 |
-2.4 |
-- |
0.0 |
-- |
-- |
242 (10.1) |
30/10 |
| BRISBANE AERO |
27.3 |
-1.0 |
17.1 |
-3.0 |
14.9 |
1.4 |
5.8 |
11.2 |
326 (13.6) |
35/14 |
| TOOWOOMBA AIRPORT |
25.0 |
-2.7 |
15.5 |
-1.2 |
-- |
0.0 |
-- |
-- |
616 (25.7) |
37/14 |
| GUNNEDAH RESOURCE CENTRE |
29.8 |
-1.2 |
16.4 |
-1.1 |
15.1 |
16.8 |
3.4 |
-- |
99 ( 4.1) |
-- |
| COFFS HARBOUR MO |
25.2 |
-1.1 |
17.1 |
-1.0 |
16.5 |
20.6 |
3.4 |
8.8 |
275 (11.5) |
45/13 |
| PORT MACQUARIE AIRPORT AWS |
26.4 |
-0.2 |
15.0 |
-1.7 |
-- |
6.0 |
-- |
-- |
-- |
-- |
| WILLIAMTOWN RAAF |
29.1 |
+1.9 |
15.4 |
-1.1 |
15.8 |
0.8 |
3.4 |
4.7 |
287 (12.0) |
52/14 |
| GOSFORD (NARARA RESEARCH STATION) AWS |
28.6 |
+1.7 |
14.4 |
-0.9 |
-- |
0.0 |
-- |
-- |
94 ( 3.9) |
28/17 |
| ORANGE AGRICULTURAL INSTITUTE |
19.7 |
-4.7 |
13.8 |
+2.5 |
7.2 |
0.6 |
3.0 |
2.0 |
-- |
-- |
| DUBBO AIRPORT AWS |
28.9 |
-2.6 |
17.8 |
+1.9 |
-- |
0.0 |
-- |
-- |
-- |
-- |
| SYDNEY AIRPORT AMO |
28.2 |
+2.5 |
19.0 |
+1.5 |
15.2 |
0.0 |
6.8 |
7.8 |
447 (18.6) |
46/13 |
| RICHMOND RAAF |
29.0 |
+0.3 |
15.9 |
-0.1 |
-- |
0.2 |
-- |
-- |
115 ( 4.8) |
57/12 |
| BELLAMBI AWS |
24.2 |
+0.1 |
19.7 |
+2.2 |
-- |
0.0 |
-- |
-- |
407 (17.0) |
44/20 |
| CANBERRA AIRPORT |
24.2 |
-1.9 |
16.6 |
+5.2 |
14.3 |
0.2 |
6.6 |
4.7 |
177 ( 7.4) |
50/13 |
| WAGGA WAGGA AMO |
28.0 |
-1.4 |
19.8 |
+6.1 |
18.7 |
0.0 |
9.0 |
2.3 |
261 (10.9) |
61/14 |
| ALBURY AIRPORT AWS |
26.1 |
-3.3 |
18.4 |
+4.7 |
-- |
0.0 |
-- |
-- |
140 ( 5.8) |
80/13 |
| MILDURA AIRPORT |
28.0 |
-2.1 |
15.7 |
+0.9 |
15.6 |
0.8 |
10.6 |
10.2 |
379 (15.8) |
65/01 |
| TATURA INST SUSTAINABLE AG |
27.7 |
+0.3 |
17.7 |
+5.5 |
-- |
4.6 |
23.6 |
-- |
320 (13.3) |
39/04 |
| BENDIGO AIRPORT |
25.8 |
-1.2 |
18.0 |
+6.5 |
-- |
0.8 |
-- |
-- |
377 (15.7) |
�
43/12 |
| MELBOURNE REGIONAL OFFICE |
24.8 |
+0.6 |
18.3 |
+5.4 |
17.0 |
3.4 |
9.4 |
-- |
208 ( 8.7) |
24/05 |
| GEELONG AIRPORT |
23.4 |
+0.5 |
17.3 |
+6.4 |
-- |
8.0 |
-- |
-- |
376 (15.7) |
46/06 |
| BALLARAT AERODROME |
22.4 |
-0.2 |
15.4 |
+6.0 |
-- |
1.2 |
-- |
-- |
497 (20.7) |
46/05 |
| LAUNCESTON (TI TREE BEND) |
24.4 |
+2.0 |
16.5 |
+5.9 |
-- |
5.2 |
-- |
-- |
212 ( 8.8) |
39/19 |
| HOBART AIRPORT |
25.1 |
+4.5 |
16.0 |
+5.3 |
13.2 |
9.0 |
8.4 |
2.2 |
394 (16.4) |
76/18 |
| |
Max
°
C |
+/- norm
°
C |
Min
°
C |
+/- norm
°
C |
Grass Min
°
C |
Rain to 9am mm |
Evaporation to 9am mm |
Sunshine hours |
Wind Run to 9am km |
Maximum Gust km/h / hour of occurrence |
|
| Hottest |
| Highest maximum temperature> | Greatest variation above normal maximum |
Highest minimum temperature | Greatest variation above normal minimum |
45.0 TENNANT CREEK AIRPORT N Plateau NT
45.0 ELLIOTT N Plateau NT
44.6 BRUNETTE DOWNS N Plateau NT
44.5 ALI CURUNG N Plateau NT
44.4 MARBLE BAR E Pilbara WA
|
+9.1 : 29.2 FLINDERS ISLAND AIRPORT Flinders Is/Bass St TAS
+7.7 : 45.0 TENNANT CREEK AIRPORT N Plateau NT
+7.3 : 43.5 PARDOO STATION E Pilbara WA
+6.7 : 43.4 PORT HEDLAND AIRPORT E Pilbara WA
+6.7 : 44.5 ALI CURUNG N Plateau NT
|
32.4 WARMUN E Kimberley WA
32.0 WYNDHAM N Kimberley WA
31.8 WYNDHAM AERO N Kimberley WA
31.8 ARGYLE AERODROME E Kimberley WA
31.2 BRUNETTE DOWNS N Plateau NT
|
+8.7 : 13.5 LAKE ST CLAIR NATIONAL PARK Central Plateau TAS
+8.2 : 20.1 MT NOWA NOWA E Gippsland VIC
+8.1 : 16.7 OUSE FIRE STATION Derwent Valley TAS
+7.9 : 19.3 RUTHERGLEN RESEARCH Lower NE VIC
+7.6 : 24.0 IVANHOE POST OFFICE Southwest Plains NSW
|
| Coldest |
| Lowest maximum temperature | Greatest variation below normal maximum |
Lowest minimum temperature | Greatest variation below normal minimum |
10.5 MOUNT BULLER Upper NE VIC
11.0 CHARLOTTE PASS (KOSCIUSKO CHALET) Snowy Mtns NSW
11.1 MT HOTHAM Upper NE VIC
11.9 MOUNT READ W Coast TAS
12.1 THREDBO AWS Snowy Mtns NSW
|
-9.5 : 23.0 LAKE CARGELLIGO AIRPORT Riverina W NSW
-6.9 : 13.0 MOUNT LOFTY Adelaide/Lofty SA
-6.6 : 18.4 MOUNT CRAWFORD FIRE TOWER Adelaide/Lofty SA
-6.5 : 23.8 MINNIPA DPI W Agricultural SA
-6.4 : 25.0 QUANDIALLA POST OFFICE SW Slopes N NSW
|
5.9 COLLIE EAST Lower West WA
6.0 JARRAHWOOD Lower West WA
6.1 WANDERING Cent Wheatbelt WA
6.8 BRIDGETOWN Lower West WA
|
-6.4 : 13.5 YEELIRRIE Goldfields WA
-6.1 : 7.6 NORSEMAN AERO Goldfields WA
-5.6 : 7.8 ESPERANCE AERO Lower West WA
-5.6 : 6.1 WANDERING Cent Wheatbelt WA
-5.6 : 11.7 TARCOOLA AERO NW Pastoral SA
|
|
Sunniest &
dullest |
Windiest |
Highest gusts |
Todays highest rainfall totals for the 24 hours to 9am. It
includes the top 5 totals nationally followed by all reported falls of 50mm or more. |
Highest
and lowest recordings of hours of sunshine for the 24 hours to midnight. |
Highest wind
run totals in kilometres for the 24 hours to 9am (average speed in brackets).
All reported runs >
=25km/h are shown. |
Highest wind
gusts in km/h for the 24 hours to midnight followed by the hour in which it occurred.
All stations with gusts >
89km/h are shown. |
122.0 DARADGEE N Coast--Herbert QLD
114.2 EL ARISH POST OFFICE N Coast--Herbert QLD
66.6 INNISFAIL N Coast--Herbert QLD
62.0 TUNG OIL ALERT N Coast--Herbert QLD
61.0 NERADA ALERT N Coast--Herbert QLD
QUEENSLAND
N Coast--Herbert
122.0 DARADGEE
114.2 EL ARISH POST OFFICE
66.6 INNISFAIL
62.0 TUNG OIL ALERT
61.0 NERADA ALERT
59.5 DUNK ISLAND RESORT
59.0 INNISFAIL WHARF ALERT
58.0 TUNG OIL TM
52.0 BINGIL BAY
52.0 RUSSELL RIVER
TASMANIA
Central Plateau
54.2 BREONA (LOWER HAULAGE ROAD)
|
13.2 PERTH AIRPORT Lower West WA
13.2 WOOMERA AERODROME NW Pastoral SA
13.1 GILES METEOROLOGICAL OFFICE Interior WA
12.9 ALICE SPRINGS AIRPORT N Plateau NT
12.5 RABBIT FLAT N Plateau NT
12.5 MOREE AERO NW Plains E NSW
.....
1.5 EAST SALE AIRPORT W Gippsland VIC
1.0 GROVE (COMPARISON) Southeast TAS
0.6 LAKE LEAKE (ELIZABETH RIVER) E Coast TAS
0.5 SCOTTSDALE (WEST MINSTONE ROAD) N Coast TAS
0.5 STRATHGORDON VILLAGE W Coast TAS
|
904 (37.7) CAPE GRIM BAPS N Coast TAS
897 (37.4) GABO ISLAND LIGHTHOUSE E Gippsland VIC
857 (35.7) RUNDLE ISLAND Wide Bay/Burnett QLD
845 (35.2) NGAYAWILI N Rivers NT
808 (33.7) NORTH ISLAND Central West WA
780 (32.5) GREEN CAPE AWS South Coast NSW
775 (32.3) MONTAGUE ISLAND LIGHTHOUSE South Coast NSW
756 (31.5) GERALDTON AIRPORT Central West WA
752 (31.3) NEPTUNE ISLAND W Agricultural SA
750 (31.3) VARANUS ISLAND Islands ISL
749 (31.2) COOBER PEDY AIRPORT NW Pastoral SA
745 (31.0) CARNARVON AIRPORT W Gascoyne WA
734 (30.6) MCCLUER ISLAND N Rivers NT
728 (30.3) LADY ELLIOT ISLAND Wide Bay/Burnett QLD
727 (30.3) COLAC (MT GELLIBRAND) W Coast VIC
725 (30.2) HERON ISLAND RES STN Wide Bay/Burnett QLD
709 (29.5) ROTTNEST ISLAND Lower West WA
709 (29.5) MOUNT READ W Coast TAS
691 (28.8) DARWIN AIRPORT N Rivers NT
680 (28.3) CEDUNA AMO W Agricultural SA
669 (27.9) BARROW ISLAND AIRPORT W Pilbara WA
658 (27.4) GOVE AIRPORT N Rivers NT
657 (27.4) THEVENARD ISLAND W Pilbara WA
652 (27.2) HAMILTON ISLAND AIRPORT Central Coast E QLD
647 (27.0) BURKETOWN AIRPORT Gulf Country QLD
636 (26.5) WOOMERA AERODROME NW Pastoral SA
634 (26.4) DOUBLE ISLAND POINT LIGHTHOUSE Brisbane/SE Coast QLD
631 (26.3) COCOS ISLAND AIRPORT Islands ISL
620 (25.8) MARREE AERO NE Pastoral SA
620 (25.8) CAPE MORETON LIGHTHOUSE Brisbane/SE Coast QLD
618 (25.8) SMITHTON AERODROME N Coast TAS
616 (25.7) SHARK BAY AIRPORT W Gascoyne WA
616 (25.7) TOOWOOMBA AIRPORT Darling Downs E QLD
613 (25.5) LEIGH CREEK AIRPORT NE Pastoral SA
612 (25.5) ALVA BEACH Central Coast E QLD
611 (25.5) MELBOURNE AIRPORT E Central VIC
|
104/16 CLONCURRY AIRPORT Gulf Country QLD
96/16 THE MONUMENT AIRPORT Northwest QLD
96/06 COLAC (MT GELLIBRAND) W Coast VIC
95/15 MOUNT ISA AERO Gulf Country QLD
89/19 WALGETT AIRPORT AWS NW Plains W NSW
89/14 NEWCASTLE NOBBYS SIGNAL STATION AWS Hunter Valley NSW
|
�