|
For notes on how to interpret
the data and quality control issues, see Daily Weather Summary Help.
**S** and **W** precede data flagged by the Bureau as suspicious or wrong
Data is as received at 00:20EST, 15/05/2012.
|
|
| |
Max
°
C |
+/- norm
°
C |
Min
°
C |
+/- norm
°
C |
Grass Min
°
C |
Rain to 9am mm |
Evaporation to 9am mm |
Sunshine hours |
Wind Run to 9am km (24-hour average km/h) |
Maximum Gust km/h / hour of occurrence |
| GERALDTON AIRPORT |
33.3 |
+5.7 |
17.4 |
+2.0 |
15.2 |
0.0 |
9.6 |
-- |
380 (15.8) |
34/22 |
| PERTH AIRPORT |
35.7 |
+10.2 |
18.2 |
+5.3 |
14.5 |
0.0 |
6.4 |
8.9 |
367 (15.3) |
32/05 |
| ALBANY AIRPORT |
23.8 |
+2.0 |
11.4 |
-0.2 |
9.7 |
0.2 |
4.2 |
5.3 |
287 (12.0) |
39/14 |
| BUNBURY |
33.1 |
+9.0 |
14.7 |
+3.2 |
-- |
0.0 |
-- |
-- |
261 (10.9) |
28/00 |
| MANDURAH |
28.9 |
-- |
19.5 |
-- |
-- |
0.0 |
-- |
-- |
314 (13.1) |
26/00 |
| DARWIN AIRPORT |
32.7 |
0.0 |
25.9 |
+1.9 |
25.4 |
0.0 |
4.6 |
9.0 |
249 (10.4) |
34/20 |
| ALICE SPRINGS AIRPORT |
30.3 |
+2.1 |
11.5 |
-1.1 |
7.6 |
0.0 |
8.0 |
11.5 |
257 (10.7) |
39/11 |
| WHYALLA AERO |
22.4 |
-1.2 |
14.7 |
+3.1 |
-- |
0.0 |
8.0 |
-- |
480 (20.0) |
41/18 |
| ADELAIDE (KENT TOWN) |
23.3 |
+0.7 |
11.6 |
-0.8 |
-- |
0.0 |
4.2 |
11.0 |
-- |
39/16 |
| MOUNT GAMBIER AERO |
17.8 |
-1.6 |
5.4 |
-3.3 |
2.3 |
0.0 |
2.2 |
2.9 |
242 (10.1) |
34/14 |
| MOUNT ISA AERO |
34.2 |
+2.3 |
18.3 |
-0.2 |
15.2 |
0.0 |
10.4 |
11.1 |
302 (12.6) |
39/11 |
| CAIRNS AERO |
30.9 |
+1.7 |
23.9 |
+2.3 |
21.6 |
0.0 |
6.2 |
9.6 |
-- |
43/15 |
| TOWNSVILLE AERO |
31.1 |
+1.5 |
19.8 |
-0.7 |
16.9 |
0.0 |
8.0 |
10.7 |
413 (17.2) |
41/13 |
| MACKAY M.O |
26.6 |
-0.1 |
20.3 |
+0.2 |
-- |
15.4 |
-- |
9.0 |
476 (19.8) |
50/11 |
| ROCKHAMPTON AERO |
30.7 |
+1.9 |
20.2 |
+2.4 |
19.2 |
0.0 |
7.2 |
-- |
379 (15.8) |
35/13 |
| BUNDABERG AERO |
29.2 |
+1.8 |
17.5 |
0.0 |
-- |
0.0 |
6.4 |
-- |
439 (18.3) |
48/14 |
| NAMBOUR DPI |
26.7 |
+0.6 |
14.5 |
-0.9 |
-- |
0.0 |
1.4 |
-- |
54 ( 2.3) |
30/11 |
| COOLANGATTA |
26.4 |
+1.1 |
16.3 |
-0.7 |
-- |
0.0 |
-- |
-- |
193 ( 8.0) |
43/12 |
| BRISBANE AERO |
27.1 |
+1.1 |
16.0 |
-0.2 |
13.3 |
0.0 |
6.2 |
10.8 |
302 (12.6) |
35/15 |
| TOOWOOMBA AIRPORT |
25.6 |
+2.2 |
15.1 |
+1.8 |
-- |
0.0 |
-- |
-- |
565 (23.5) |
46/09 |
| GUNNEDAH RESOURCE CENTRE |
28.3 |
+3.2 |
17.1 |
+4.3 |
13.2 |
0.0 |
5.0 |
-- |
164 ( 6.8) |
-- |
| COFFS HARBOUR MO |
24.7 |
+0.7 |
17.0 |
+1.8 |
14.5 |
0.0 |
4.4 |
4.9 |
251 (10.5) |
34/10 |
| PORT MACQUARIE AIRPORT AWS |
25.8 |
+1.8 |
15.5 |
+1.8 |
-- |
0.0 |
-- |
-- |
-- |
-- |
| WILLIAMTOWN RAAF |
23.6 |
0.0 |
16.1 |
+2.9 |
15.4 |
28.6 |
4.4 |
6.2 |
310 (12.9) |
50/07 |
| GOSFORD (NARARA RESEARCH STATION) AWS |
24.6 |
+1.0 |
15.7 |
+3.8 |
-- |
1.2 |
-- |
-- |
102 ( 4.3) |
21/13 |
| ORANGE AGRICULTURAL INSTITUTE |
23.0 |
+4.5 |
10.2 |
+3.0 |
5.9 |
0.0 |
3.4 |
8.5 |
-- |
-- |
| DUBBO AIRPORT AWS |
29.0 |
+4.5 |
16.7 |
+6.6 |
-- |
0.0 |
-- |
-- |
-- |
-- |
| SYDNEY AIRPORT AMO |
24.4 |
+1.5 |
18.4 |
+4.3 |
15.5 |
0.0 |
4.4 |
6.1 |
445 (18.5) |
43/07 |
| RICHMOND RAAF |
24.3 |
+0.4 |
15.7 |
+4.4 |
-- |
0.0 |
-- |
-- |
134 ( 5.6) |
34/16 |
| BELLAMBI AWS |
23.7 |
+1.6 |
17.1 |
+1.7 |
-- |
0.8 |
-- |
-- |
373 (15.5) |
34/17 |
| CANBERRA AIRPORT |
24.5 |
+4.5 |
14.8 |
+8.1 |
13.9 |
0.0 |
4.6 |
7.3 |
148 ( 6.2) |
28/19 |
| WAGGA WAGGA AMO |
28.1 |
+5.6 |
12.4 |
+3.3 |
11.0 |
0.0 |
6.8 |
10.9 |
271 (11.3) |
34/15 |
| ALBURY AIRPORT AWS |
27.1 |
+4.7 |
9.6 |
+1.6 |
-- |
0.0 |
-- |
-- |
123 ( 5.1) |
34/14 |
| MILDURA AIRPORT |
24.8 |
+1.3 |
8.7 |
-1.4 |
7.0 |
0.0 |
4.8 |
10.6 |
276 (11.5) |
32/14 |
| TATURA INST SUSTAINABLE AG |
23.3 |
+1.7 |
9.2 |
+1.0 |
-- |
0.0 |
6.2 |
-- |
434 (18.1) |
28/00 |
| BENDIGO AIRPORT |
23.1 |
+1.9 |
5.7 |
-1.7 |
-- |
0.0 |
-- |
-- |
364 (15.2) |
�
34/20 |
| MELBOURNE REGIONAL OFFICE |
20.5 |
+0.2 |
12.1 |
+1.3 |
9.5 |
0.0 |
3.2 |
-- |
172 ( 7.2) |
22/11 |
| GEELONG AIRPORT |
19.2 |
-0.8 |
14.0 |
+4.7 |
-- |
0.0 |
-- |
-- |
298 (12.4) |
35/14 |
| BALLARAT AERODROME |
18.8 |
+1.2 |
7.1 |
-0.3 |
-- |
0.0 |
-- |
-- |
508 (21.2) |
39/08 |
| LAUNCESTON (TI TREE BEND) |
19.1 |
+0.2 |
3.7 |
-3.8 |
-- |
0.0 |
-- |
-- |
77 ( 3.2) |
30/14 |
| HOBART AIRPORT |
20.2 |
+2.1 |
7.1 |
-1.6 |
2.0 |
0.0 |
2.0 |
9.9 |
305 (12.7) |
37/11 |
| |
Max
°
C |
+/- norm
°
C |
Min
°
C |
+/- norm
°
C |
Grass Min
°
C |
Rain to 9am mm |
Evaporation to 9am mm |
Sunshine hours |
Wind Run to 9am km |
Maximum Gust km/h / hour of occurrence |
|
| Hottest |
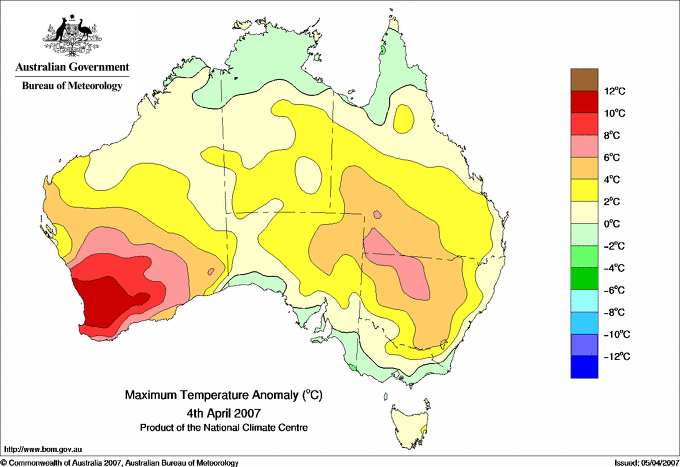
| Highest maximum temperature> | Greatest variation above normal maximum |
Highest minimum temperature | Greatest variation above normal minimum |
39.0 EMU CREEK STATION W Gascoyne WA
38.4 ROEBOURNE E Pilbara WA
38.2 MARDIE W Pilbara WA
38.2 ENEABBA Central West WA
38.1 TOORAK RESEARCH STATION Gulf Country QLD
|
+12.4 : 38.0 KELLERBERRIN Cent Wheatbelt WA
+11.5 : 35.6 CORRIGIN Cent Wheatbelt WA
+11.1 : 35.0 LAKE GRACE COMPARISON Cent Wheatbelt WA
+10.9 : 36.2 MERREDIN Cent Wheatbelt WA
+10.9 : 35.3 WANDERING Cent Wheatbelt WA
|
26.9 VARANUS ISLAND Islands ISL
26.3 OENPELLI N Rivers NT
26.3 DUM IN MIRRIE AWS N Rivers NT
26.0 BLACK POINT N Rivers NT
26.0 COCONUT ISLAND N Peninsula QLD
26.0 CAPE DON N Rivers NT
26.0 FLINDERS REEF Islands ISL
26.0 TROUGHTON ISLAND N Kimberley WA
|
+9.0 : 18.0 HAY CSIRO AWS Riverina W NSW
+8.9 : 24.9 MOUNT MAGNET AERO E Gascoyne WA
+8.6 : 15.0 TIDBINBILLA NATURE RESERVE Goulburn/Monaro NSW
+8.2 : 21.0 MERREDIN Cent Wheatbelt WA
+8.1 : 14.8 CANBERRA AIRPORT Goulburn/Monaro NSW
|
| Coldest |
| Lowest maximum temperature | Greatest variation below normal maximum |
Lowest minimum temperature | Greatest variation below normal minimum |
10.2 MOUNT WELLINGTON Southeast TAS
10.2 MOUNT READ W Coast TAS
11.0 MT HOTHAM Upper NE VIC
11.2 THREDBO AWS Snowy Mtns NSW
11.5 HARTZ MOUNTAIN (KEOGHS PIMPLE) Southeast TAS
|
-3.4 : 18.7 BEGA AWS South Coast NSW
-2.5 : 20.8 PRICE Yorke Pen/Kanga Is SA
-2.5 : 19.8 STRATHALBYN RACECOURSE Murray Valley SA
-2.5 : 20.8 CLEVE AERODROME W Agricultural SA
-2.4 : 17.7 WARRNAMBOOL AIRPORT NDB W Coast VIC
|
-4.4 LIAWENEE Central Plateau TAS
-1.2 LAKE LEAKE (ELIZABETH RIVER) E Coast TAS
-1.1 LAKE ST CLAIR NATIONAL PARK Central Plateau TAS
-0.1 CRESSY RESEARCH STATION N Coast TAS
0.0 FINGAL (LEGGE STREET) E Coast TAS
|
-8.4 : 19.0 NORTHERN ENDEAVOUR Islands ISL
-6.2 : 1.4 COONAWARRA Lower SE SA
-5.8 : 4.9 FLINDERS ISLAND AIRPORT Flinders Is/Bass St TAS
-5.4 : -0.1 CRESSY RESEARCH STATION N Coast TAS
-5.4 : 0.0 FINGAL (LEGGE STREET) E Coast TAS
|
|
Sunniest &
dullest |
Windiest |
Highest gusts |
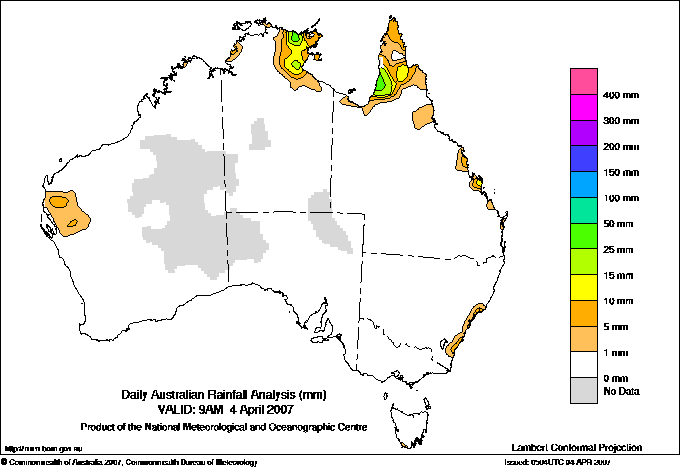
Todays highest rainfall totals for the 24 hours to 9am. It
includes the top 5 totals nationally followed by all reported falls of 50mm or more. |
Highest
and lowest recordings of hours of sunshine for the 24 hours to midnight. |
Highest wind
run totals in kilometres for the 24 hours to 9am (average speed in brackets).
All reported runs >
=25km/h are shown. |
Highest wind
gusts in km/h for the 24 hours to midnight followed by the hour in which it occurred.
All stations with gusts >
89km/h are shown. |
152.0 BAMAGA N Peninsula QLD
55.0 THE ENTRANCE (ELOORA STREET) Hunter Valley NSW
53.6 PUNSAND BAY N Peninsula QLD
45.2 ROSE BAY (ROYAL SYDNEY GOLF CLUB) Sydney--east NSW
41.6 COORALYA W Gascoyne WA
WESTERN AUSTRALIA
W Gascoyne
41.6 COORALYA
QUEENSLAND
N Peninsula
152.0 BAMAGA
53.6 PUNSAND BAY
NEW SOUTH WALES
Hunter Valley
55.0 THE ENTRANCE (ELOORA STREET)
Sydney--east
45.2 ROSE BAY (ROYAL SYDNEY GOLF CLUB)
|
11.5 ALICE SPRINGS AIRPORT N Plateau NT
11.4 GILES METEOROLOGICAL OFFICE Interior WA
11.2 BROOME AIRPORT W Kimberley WA
11.2 RABBIT FLAT N Plateau NT
11.1 MOUNT ISA AERO Gulf Country QLD
.....
4.9 COFFS HARBOUR MO MidNorth Coast N NSW
4.1 STRATHGORDON VILLAGE W Coast TAS
2.9 MOUNT GAMBIER AERO Lower SE SA
2.8 EAST SALE AIRPORT W Gippsland VIC
1.2 WEIPA AERO N Peninsula QLD
|
930 (38.8) MAATSUYKER ISLAND LIGHTHOUSE Southeast TAS
865 (36.0) LOW ISLES LIGHTHOUSE N Coast--Barron QLD
840 (35.0) WILLIS ISLAND Islands ISL
775 (32.3) HARTZ MOUNTAIN (KEOGHS PIMPLE) Southeast TAS
761 (31.7) CAPE FLATTERY N Coast--Barron QLD
754 (31.4) RUNDLE ISLAND Wide Bay/Burnett QLD
746 (31.1) LADY ELLIOT ISLAND Wide Bay/Burnett QLD
725 (30.2) DOUBLE ISLAND POINT LIGHTHOUSE Brisbane/SE Coast QLD
695 (29.0) KILMORE GAP N Central VIC
642 (26.8) CAPE MORETON LIGHTHOUSE Brisbane/SE Coast QLD
|
83/23 MAATSUYKER ISLAND LIGHTHOUSE Southeast TAS
76/23 MOUNT WELLINGTON Southeast TAS
70/15 MOUNT BOYCE AWS C Tablelands S NSW
68/22 HARTZ MOUNTAIN (KEOGHS PIMPLE) Southeast TAS
61/07 NEWCASTLE NOBBYS SIGNAL STATION AWS Hunter Valley NSW
|
�